Showing posts with label 白银. Show all posts

Wednesday, August 15, 2018

全球资产泡沫化??

过去几年里,全球资产泡沫已经愈演愈烈。
数据显示,2016年底全球房地产价值为228万亿美元,而2017年底,全球房地产价值已经创下281万亿美元的新纪录。
2017年底的全球主流资产价值:
全球房地产价值为281万亿美元,国债价值为105万亿美元,全球股票总值为83万亿美元,而黄金白银仅为3.1万亿美元。
2016年的全球主流资产价值:
全球房地产价值为228万亿美元,国债价值为100万亿美元,全球股票总值为70万亿美元,黄金白银为3.1万亿美元。
2016年到2017年,仅仅一年的时间,全球房地产价值增长23%,国债价值增长5%,全球股票价值增长22%,而黄金白银几乎没有变化。
2015年的全球主流资产价值:
2015年到2017年两年来看,黄金白银和其他资产的差距进一步扩大,2015年至2017年全球房地产价值增长64万亿美元,股票价值增长28万亿美元,国债价值增加11万亿美元,而黄金白银还是近乎零增长。
分析机构Money Metals News Service表示,短短两年内,全球房地产、国债和股票总价值上升就超过了100万亿美元,市场处于极度泡沫状态,预计在未来的10年内,这三类资产的价值就将缩水50%,庞大的资金将从这些被极度高估的资产中流出,贵金属市场将再次受到人们的青睐,长期来看,黄金白银价格将迎来大涨。

Friday, March 10, 2017

數據不會“說謊”,白銀值得持有的三大理由

匯金網訊: 白銀市場的需求正在回升,儘管目前水平與2016年7月觸及的高點仍相距甚遠。美國白銀期貨市場顯示白銀受到投資者熱捧,自2015年中期以來,中國持有白銀的數量也迅速攀升。此外,摩根大通也在積極囤積白銀。
【理由一、生產商持有的白銀凈空頭頭寸攀升】
美國白銀期貨市場顯示白銀受到投資者熱捧,生產商持有的白銀期貨的總頭寸達到了19.76萬手合約,而去年八月觸及的記錄高位是22.45萬手合約。
數據不會“說謊”,白銀值得持有的三大理由
(生產商持有白銀凈頭寸)
截至2017年2月28日,生產商持有的白銀凈空頭頭寸達到了54.7%,這是自2016年初開始的白銀上漲周期中最大的比例。生產商持有大量的凈空頭頭寸相當於投機者持有大量的凈多頭頭寸,這推高了白銀價格。
而有趣的是,白銀價格較2016年8月初下跌了11.4%,現貨白銀目前交投於17.81美元/盎司。
但是兩個跡象顯示了投資者對白銀的需求正在升溫:生產商持有的凈空頭頭寸較去年八月高(54.7% VS 48.6%),投機者持有的凈多頭頭寸高於去年八月(48.3% VS 44.5%)。
數據不會“說謊”,白銀值得持有的三大理由
(投機者持有的凈多頭頭寸)
四家最大的生產商持有的白銀期貨凈空頭頭寸自2014年底以來一直處於上升趨勢,而目前幾乎接近這一周期中的觸及的最高水平。
數據不會“說謊”,白銀值得持有的三大理由
(四家最大的生產商持有的白銀期貨凈空頭頭寸)
【理由二:中國持有白銀的庫存迅速攀升】
自2015年中期以來,中國持有白銀的數據迅速攀升。截至2017年1月底,上海期貨交易所持有的白銀庫存達到紀錄水平6410萬盎司,而這一數據自那時起持續增加,目前已經攀升至6870萬盎司。
數據不會“說謊”,白銀值得持有的三大理由
(上海期貨交易所白銀庫存)
【理由三:國際大投行摩根大通積極囤積白銀】
此外,摩根大通也在積極囤積白銀。自2016年底以來,摩根大通增持了940萬盎司白銀。這對白銀走勢發出更加積極的信號。
數據不會“說謊”,白銀值得持有的三大理由
不過北美的投資者似乎對白銀的熱情減弱。iShares白銀信託基金,世界上最大的私人白銀持有者,其公布的報告顯示,自2017年初以來,白銀持有量下降了860萬盎司。
 來源: 匯金網

Friday, July 1, 2016

Gold and Silver? - Jeff Clark, Senior Precious Metals Analyst

If the Stock Market Crashes, What Happens to Gold and Silver? - Jeff Clark, Senior Precious Metals Analyst
We received a lot of queries asking if it would be better to wait to buy gold until after the stock market crashes.

After all, Mike has warned that a stock market crash is likely. Given what happened to global markets from the Brexit surprise, it’s a timely question.

And if the market takes a dive, many investors think gold and silver prices will fall, too.

If so, wouldn’t it be better to wait to buy them until after the dust settles?

Probably the best way to answer this is to look at what’s happened in the past…
 

The Message From History


I looked at past stock market crashes and measured gold and silver’s performance during each of them, to see if there are any lessons we can learn.

The following table shows the eight biggest declines in the S&P over the past 40 years, and how gold and silver responded to each.
There are some reasonable conclusions we can draw from this historical data.
 
  1. In most cases, the gold price rose during big stock market crashes.Notice this was regardless of whether the crash was short-lived or stretched over a couple years. Gold even climbed in the biggest crash of them all, the 56% decline that lasted two full years in the early 2000s. It seems clear that we should not assume gold will fall in a stock market crash… just the opposite has occurred more often.

    The reason for this is because gold generally has a negative correlation with the stock market. In other words, when one goes up, the other tends to go down. Which makes sense… if the stock market falls, fear is usually high—and investors typically seek out the safe haven of gold. If stocks are rocking and rolling, the perceived need for gold from the mainstream is low.

    You’ll recall gold did fall in the initial shock of the 2008 financial crisis. But while the S&P continued to decline, gold rebounded and ended the year up 5.5%. Over the total 18-month stock market selloff, gold ended that period up over 25%. The lesson here is that one should not panic if gold temporarily suffers from a stock market collapse. And of course see it as a buying opportunity.
     
  2. Gold’s only significant selloff (-46% in the early 1980s) occurred just after its biggest bull market in modern history. Gold rose over 2,300% from its 1970 low to the 1980 peak… so it isn’t terribly surprising that it fell with the broader stock market at that point.

    We have the opposite situation today. Yes, gold is up roughly 24% year-to-date, but we’re still coming out of a punishing four-year bear market where the price declined by as much as 45%.
     
  3. Silver did not fare so well during stock market crashes. In fact, it rose in only one of the S&P selloffs (and was basically flat in another one).

    This is likely due to silver’s high industrial use, and that stock market selloffs are usually associated with a poor or deteriorating economy.

    However, notice that silver’s biggest rise (+15% in the 1970s) took place amidst its biggest bull market in history. It also did not decline during the financial crisis period of late 2007 to early 2009, which was its second biggest bull market. In other words, we have historical precedence that silver could do well in a stock market crash if it is already in a bull market. Otherwise it could struggle.
The overall message from history is this: odds are good that gold won’t crash if the stock market does. Silver might depend on whether it’s in a bull market.
 

What if the Stock Market Doesn’t Crash?


We have to consider another scenario: what if the stock market doesn’t fall off a cliff?

Or what if it’s just flat for a long period of time? The 1970s (through 1980) saw three recessions, an oil embargo, interest rates that hit 20%, and the Soviet invasion of Afghanistan.

Look what the S&P did during that turbulent period, along with gold.
The S&P basically went nowhere during the entire decade of the 1970s. After 10 years it was up a measly 14.3% (excluding dividends and commissions). Gold, on the other hand, rose from $35 per ounce to its January 21, 1980 peak of $850, an incredible 2,328%.

In other words, gold’s biggest bull market in modern history occurred while the stock market was essentially flat. That’s because the catalysts for higher gold weren’t solely related to the stock market—they were more about everything else going on at the time. We have to allow for the possibility that this happens again: citizens are drawn to gold due to other pressing concerns besides the performance of the S&P.

I’m not suggesting there won’t be a stock market crash. Odds are better than 50/50 that’s what we’ll get. But if we do, history shows that gold may not crash with it. Or it might fall only temporarily. Or we might not get a crash at all.

For these reasons, I think it is wise to own a good chunk of gold now.

Anything can happen when markets are hit with extraordinary volatility. But consider all the risks we face today… do you really want to be without gold right now? I don’t.

Perhaps the ideal solution is to have a stash of cash ready to deploy if we get another big decline in precious metals—but also have a stash of bullion already set aside in case the next crisis sends gold off to the races.

Friday, June 17, 2016

Silver Assets Climb to Record as ‘Forgotten’ Metal Soars

Holdings in exchange-traded funds backed by silver swelled to a record as investors sought a haven from global economic and political risk.
Assets expanded 72.6 metric tons to 20,227.2 tons as of Wednesday and have risen 7.3 percent this year, data compiled by Bloomberg show. Prices have advanced 28 percent in 2016, outperforming gold, as investors scale back expectations for increases in U.S. interest rates, benefiting precious metals because they don’t offer yields or dividends.
Federal Reserve Chair Janet Yellen signaled Wednesday that secular forces may keep borrowing costs lower for longer, which helped push gold to the highest level since 2014. Silver joined the rally, adding 2 percent. Investor anxiety over a British vote June 23 on whether to leave the European Union is also bolstering prices.
“When there is big buying in precious metals, silver sometimes leads the way up,” Bob Takai, chief executive officer and president of Sumitomo Corp. Global Research Co., said by phone from Tokyo. “It’s very natural for investors to run for the safe haven which is gold and silver.”
Investors have added 421.6 tons of gold to exchange-traded funds in 2016, the most for any year since 2009, after reducing holdings for three straight years, according to data compiled by Bloomberg. Silver assets have risen 1,370 tons this year, the most since 2012.

‘Value Opportunity’

“The case for silver will just get stronger and stronger because silver was essentially forgotten by much of the investment community for a long time, thereby creating a great value opportunity both in absolute terms and relative to gold,” Gregor Gregersen, chief executive officer and founder of Singapore-based Silver Bullion Pte., said in an e-mail before the data were released.
An ounce of gold bought 73.7 ounces of silver on Thursday from a high of 83.8 ounces at the end of February, which was a level last seen during the 2008 financial crisis.
Silver looks ready to outperform gold now with the ratio moving lower in a consistent fashion, signaling a genuine bull market condition for both metals, according to Ned Naylor-Leyland, manager of Old Mutual’s Gold and Silver Fund in London.

Friday, June 3, 2016

The Shocking Reason Why China Will Send The Price Of Silver Skyrocketing Over $100!

With so much focus on the West’s massive money printing schemes, here is the shocking reason why China will send the price of silver skyrocketing over $100.
Stephen Leeb:  “Whatever your views about climate change, the reality is that the world as a whole is rushing to replace fossil fuels with renewable energies (along with nuclear, which is so plentiful that for all intents and purposes it can count as renewable). And while in recent articles we’ve focused on the forthcoming massive bull market ahead in gold, the transition to renewables will mean at least comparable opportunities for investors in another metal: silver, which is destined to soar into triple-digit territory

In Volatile Markets, Is Wealth Preservation King?
In a King World News interview I spoke with the man who predicted the Swiss National Bank would experience staggering losses and that the Fed would also experience massive losses that will destabilize the global financial system! His company is the only one in the world offering a precious metals investment service outside the banking system, with direct ownership and full control by the investor. He has also become legendary for his predictions on QE, historic moves in currencies, and major global events. To find out what he and his company can do to help answer that age old question for you CLICK HERE.
GoldSwitzerland - New Ad PicSponsored

Stephen Leeb continues:  “While gold’s rise will mainly reflect its role as a currency as commodity shortages emerge, silver – which also has a history over the millennia as a precious metal – possesses special qualities as an industrial metal that will give it an added kick. For instance, it’s one of the best conductors of both electricity and heat, giving silver a critical role in industrial applications ranging from automobiles to computers and mobile phones (and virtually all modern electronic devices).
KWN Leeb I 5:28:2016
Silver Playing A Massive Role In Renewable Enegery
And of rising importance as the world seeks to move away from fossil fuels, silver is also a critical component in photovoltaics, a renewable energy whose growth over the past decade has been spectacular at nearly 100-fold. In 2006 photovoltaics was just a twinkle in European and Middle Eastern eyes. Recently China has been leading its growth: in the past five years, China has counted for around 50 percent of solar’s gains.

Shocking Chinese Demand To Send Silver Prices Skyrocketing
Looking ahead, estimates of growth in photovoltaics between 2015 and 2020 range from about 250 gigawatts (the IEA) to well over 400 gigawatts (Bloomberg New Energy). Moreover, virtually all reputable researchers expect accelerating growth through at least the next decade. China had installed about 45 gigawatts of photovoltaics by 2015. It aims for 1000 gigawatts  by 2030, nearly five times what the entire world has installed today.

Basic math shows what this means for silver consumption. Today it takes about 2.8 million ounces of silver to produce one gigawatt of solar power. If we assume that about 650 gigs will be installed worldwide by 2020, simple multiplication and division tell us that about 35,000 tons of silver, or 1 billion ounces, will be needed by 2020.
And photovoltaics constitutes just one part of the demand side for silver. Demand for silver for computers, the internet of things, and, indeed anything electronic – and for coins and jewelry, especially in the East – will also continue to grow. But solar energy will be responsible for the greatest growth in demand.
King World News - Commercial Short Positions In Silver Hit All-Time Highs! Gold Shorts Near All-Time Record!World To Face Massive Silver Shortages
So where will all this extra silver come from? According GFMS, a division of Thompson and Reuters, silver supplies have peaked. In its most recent analysis it sums up the supply situation as follows: “Declining total supply is expected to be a key driver of annual deficits in the silver market going forward.” In other words, when you combine the basic demand math along with supply assumptions, the world is facing a five-year supply shortage that amounts to more than one year of production, or enough to draw down to nearly zero all the aboveground silver inventories that might be used to fill the gap.

After 2020, increasing silver demand will mean increasing rationing of the metal, which can only be done by via extraordinarily high prices. Of the world’s major countries, only China seems to get the message and to be preparing for this eventuality, with China’s recent silver imports soaring to five-year highs. Meanwhile, U.S. imports have stagnated.
Barring a miracle, silver prices are going to the moon, leaving the U.S. in a very difficult position. It would not surprise us one bit if silver is confiscated much like gold was during the Depression. This means, as was the case with gold, the best investments are likely to be silver producers. Over the next decade almost all credible silver producers could see their prices multiply by anywhere from 10- to 100-fold.” ***KWN has now released Pierre Lassonde’s remarkable audio interview, where he discusses his $10,000+ gold price prediction and much more CLICK HERE OR ON THE IMAGE BELOW.

Thursday, May 5, 2016

Stand Aside JP Morgan!

From the SRSRocco Report:
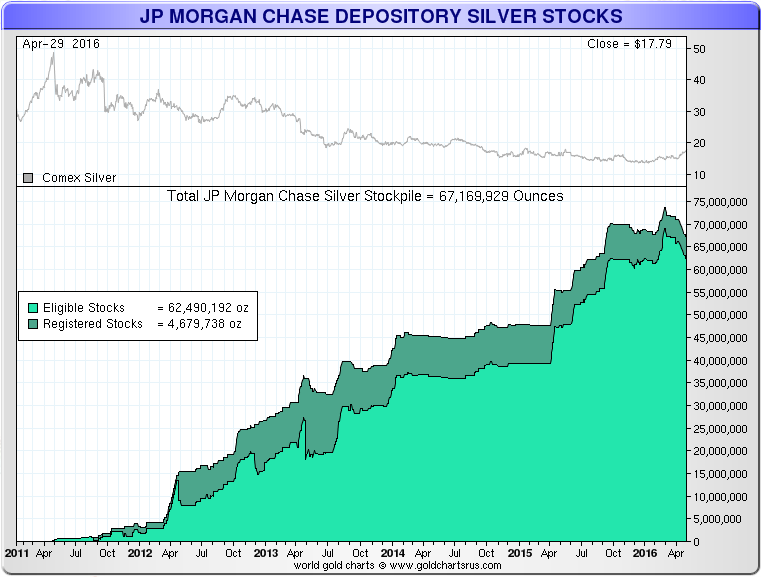
The days of JP Morgan controlling the silver market may be numbered as a new player in the silver market has arrived.  For the past several years, JP Morgan held the most silver on a public exchange in the world.  While the LBMA may hold (or did hold) more silver, their stockpiles are not made public.
Regardless, JP Morgan held the most silver at nearly 74 million oz (Moz) in its warehouse, up until recently.  Over the past two month, JP Morgan’s silver inventories have fallen nearly 7 Moz to 67.1 Moz today:
JP-Morgan-Silver-Stocks-050316
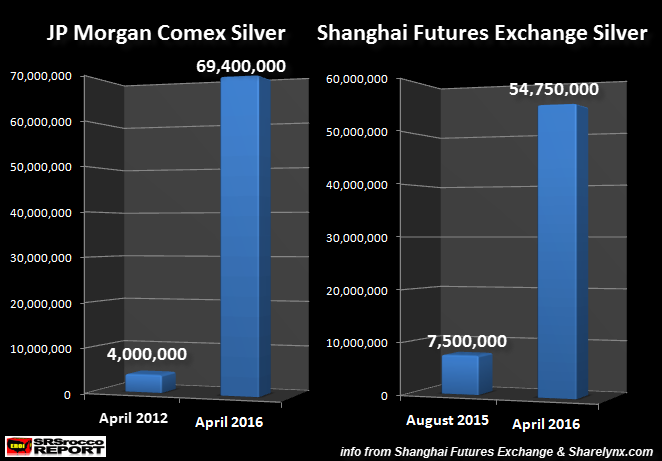
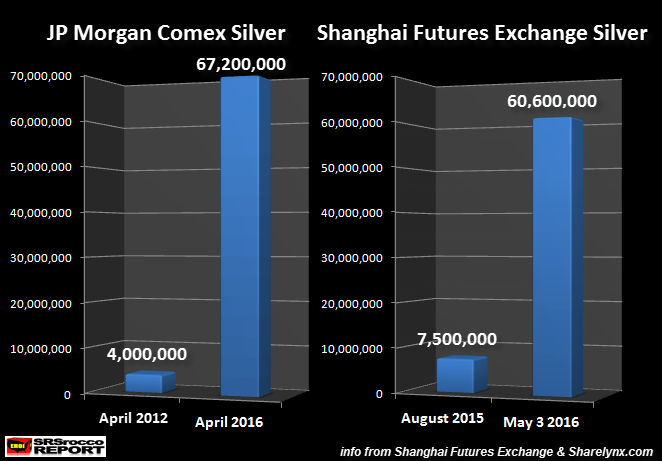
As I mentioned in my previous article, Why Are The Chinese Stockpiling Silver? Big Move Coming?, JP Morgan increased their silver inventories from 4 Moz in April 2011 to 69.4 Moz April 19, 2016.  However, the Shanghai Futures Exchange silver inventories surged from 7.5 Moz in August 2015 to 54.7 Moz on April 19, 2016:
JP-Morgan-vs-SHFE-Silver-Inventories-NEw
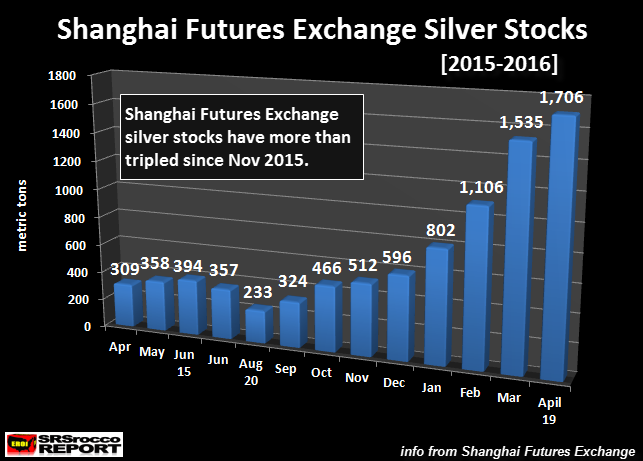
Basically, JP Morgan added an average 16.3 Moz of silver each year for the past years, whereas the Shanghai Futures Exchange added nearly 7 Moz per month.  Furthermore, the majority of gains came since the beginning of 2016.  Again, here is my previous Shanghai Futures Exchange silver stock chart from the article linked above:
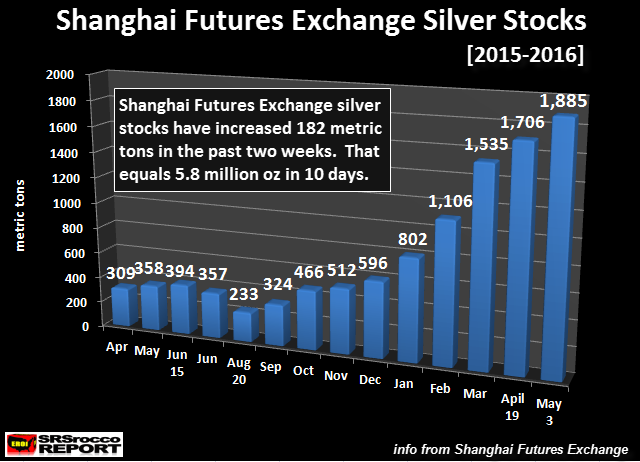
Shanghai-Futures-Exchange-Silver-Stocks-2015-2016-NEW
As we can see from this chart dated April 19th, the Shanghai Futures Exchange more than tripled their silver inventories since November 2015.  What is even more interesting is the continued buildup over the past two weeks.  Here is an updated chart based on data for May 3rd:
Shanghai-Futures-Exchange-Silver-Stocks-050316.NEW
Over the past two weeks, the Shanghai Futures Exchange added another 179 metric tons (mt) or 5.8 Moz.  Now, if we update the JP Morgan and Shanghai Futures Exchange silver stock chart (from above) we have the following:
JP-Morgan-vs-SHFE-Silver-Inventories-050316
Here we can see that JP Morgan’s total physical silver inventories have declined from 69.4 Moz to 67.2 Moz, while the Shanghai Futures Exchange silver stocks have increased from 54.7 Moz to 60.6 Moz.  If the Shanghai Futures Exchange continues to add silver at this rate, it will surpass JP Morgan in a two to three weeks.

Comex Registered Silver Inventories Drop Nearly 4 Million Ounces Yesterday

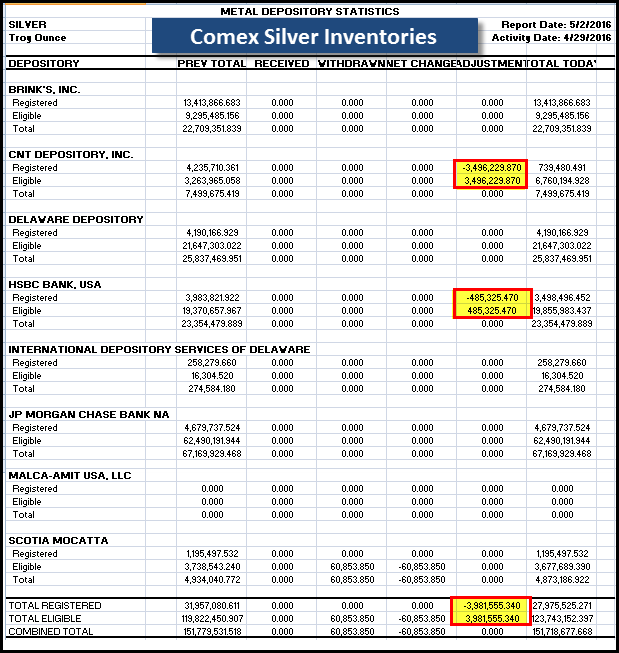
When the CME Group published the recent silver inventory change on the Comex yesterday, nearly 4 Moz were transferred from the Registered to Eligible Category.  The majority of the transfer came from the CNT Depository at nearly 3.5 Moz with 485,325 oz from HSBC:
Comex-Silver-Inventories-050316
Some analysts say these transfers really don’t mean much if the overall inventories stay the same.  That may be true, but there was some reason the CNT Depository transferred 3.5 Moz of silver from their Registered Inventories to the Eligible.
That being said, the Chinese are adding a lot of silver to their Shanghai Futures Exchange warehouses.  The build from 7.5 Moz in August 2015 to over 60 Moz of silver in the beginning of May puts JP Morgan’s four-year inventory growth to shame.
For whatever reason, silver inventories at the Shanghai Futures Exchange warehouses are increasing at a rapid pace while the Comex silver stocks continue to declineComex silver inventories were over 180 Moz in July 2015 and are now only 151 Moz.  This is quite interesting as the Shanghai Futures Exchange inventories started to build from 7.5 Moz in August 2015 to the 60.6 Moz today.
It will be interesting to see how the exchange inventories and the action in the price of silver play out over the next several months.

Tuesday, April 26, 2016

Silver’s on Fire

Another interesting week, in that the price of silver separated from the price of gold. The former went no nowhere, while the latter gained over 4.5%.
We get the trading thesis, that if the precious metals are in a bull market, then silver should go up more than gold. Silver is the high-beta gold. It’s a smaller market, less liquid, and at the same time it’s the preferred vehicle for betting on a rising price.
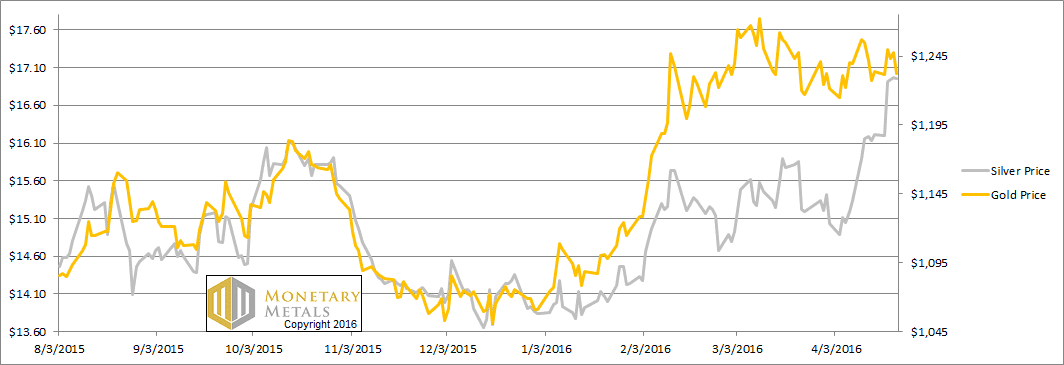
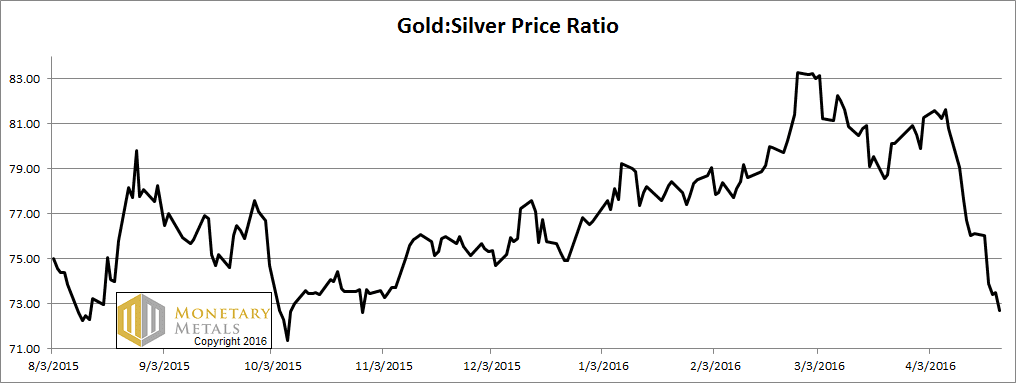
We don’t quite get the thesis that gold is going nowhere or even down, and bet on silver which is going to $50. Yet that is now our market reality. Excited silver bulls have watched as pushed silver up from $14 in late January to $17. Meanwhile the price of gold went from $1,100 to $1,260 and then back down to $1,230. The gold silver ratio initially rose from 78.5 to over 83, and down so far to 72.7.
The growing consensus is bullish. As always, we’re more interested in the fundamentals than in opinions. Let’s look at the only true picture of supply and demand fundamentals. But first, here’s the graph of the metals’ prices.
The Prices of Gold and Silver
letter apr 24 prices
Next, this is a graph of the gold price measured in silver, otherwise known as the gold to silver ratio. The ratio was down sharply again this week.
The Ratio of the Gold Price to the Silver Price
letter apr 24 ratio
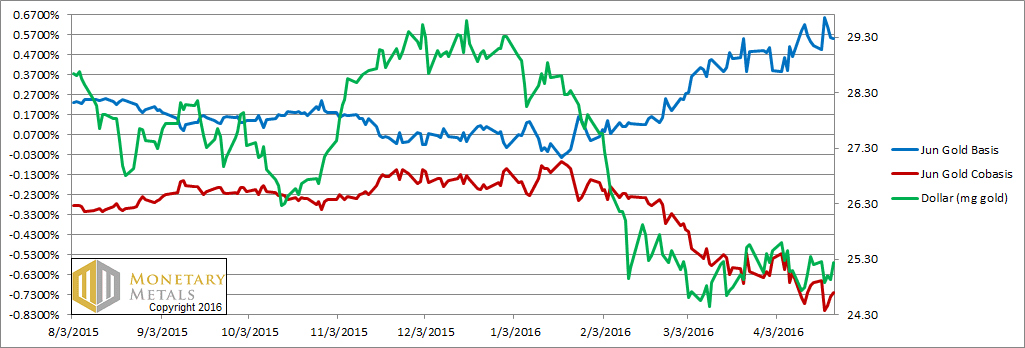
For each metal, we will look at a graph of the basis and cobasis overlaid with the price of the dollar in terms of the respective metal. It will make it easier to provide brief commentary. The dollar will be represented in green, the basis in blue and cobasis in red.
Here is the gold graph.
The Gold Basis and Cobasis and the Dollar Price
letter apr 24 gold
Look at that. Carrying gold for June delivery is now even more profitable, over 55 basis points. This is up from last week at 51bps. The increase tells us something. However much gold was carried last week, it became incrementally more attractive to carry this week.
A positive basis is a measure of abundance. This is because it tells us about the profitability of buying metal to warehouse in carry trades. If profitability is rising, then that means the marginal demand for metal is to put into the warehouse.
Not a bullish sign, with a flat to falling price. Indeed our fundamental price for gold is still sagging, down another six Federal Reserve Notes this week.
Now let’s turn to silver.
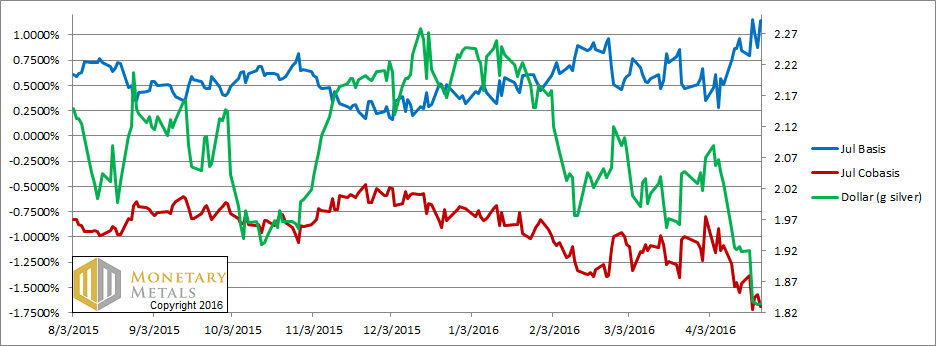
The Silver Basis and Cobasis and the Dollar Price
letter apr 24 silver
How much higher can the price of silver go? One talk show host appealed to the “silver faithful” with a promise of a price to skyrocket to levels even they will find “stunning”.
Our response is to point to the basis (blue line). Note that we switched from May to July.
If gold is showing some signs of abundance, silver is practically lying about in the marketscape. To carry silver for July delivery yields an annualized profit of over 1.1%. The flow of metal into the carry trade must be a torrent. If anything occurs that will stun the silver faithful, it will be the epic drop in the silver price. This will be decried as a smashdown.
Our calculated fundamental price did rise a dime this week, but it’s more than two fiat units below the market price.
There are times when the basis analysis does not predict a price move. We certainly did not call for the price of silver to jump. It’s speculation, or “animal spirits” if you will. However, then the basis can predict the reversal of the speculative move.
To be conservative—though this risks missing a quick collapse—one should wait to see the momentum peter out. As we often say at times of bearishness, we NEVER RECOMMEND NAKED SHORTING a monetary metal. The way to play this move would be to go long gold and short silver. If the gold silver ratio is 70, short 70 ounces of silver for every ounce of gold you buy.
70 would be an attractive entry point (assuming momentum dies by then). If the ratio rises to 83, then you have a gain of over 18.5%. For example, if you buy 100oz gold and short 7,000 oz silver, you will pick up over 15.6 ounces of gold.
© 2016 Monetary Metals

Central Banks may soon start buying silver

Only when the tide goes out do you discover who’s been swimming naked.” – Warren Buffett
silver storage
In case of emergency, central banks go back to what they know and to what works. Once silver was a monetary commodity for central banks, today only investors buy silver. Central banks have little to none silver, but things can change – fast. In case of emergency, silver can reclaim its monetary status.
Most investors will see you as a fool when you say central banks can start buying silver even when they aren’t interested in gold. But when you think a little further, it’s not a crazy idea after all. But first you must understand the meaning of money.
Money is …
  • Divisible: should be divisible in smaller units
  • Portable: able to carry it around
  • Homogenous: one unit should be the same as any another unit
  • Durable:  should not be able to be easily destroyed or eroded
  • Valuable: should have intrinsic value
Centuries ago people chose gold as the best to be money. That’s why all over the world gold is considered money, in every county on earth gold is the same and it has intrinsic value. That’s also the reason central banks love gold (yes they do).

Investing in silver before central banks heat up the price

But silver is also divisible, portable, homogenous, durable and valuable. A long time ago central banks had silver in their vaults as a safe haven. But now silver is almost entirely demonetized.  Bretton Woods killed silver definitely when the world embraced gold and the US Dollar as true money.
While central banks were still holding gold as part of their reserves, silver was sold off. That’s why some see gold as money but silver only as a commodity.
Many would say that central banks hate gold, based on the majority of their actions over the last 100 years, at least. However, it is not that central banks hate gold per se, but they hate it when it is in their interest to do so, and they love it when they need it.
In the seventies central banks bought gold because there wasn’t much faith in fiat currency. Faith stabilized in the eighties so gold reserves stayed the same. From the nineties till the financial crisis fiat currency was king and gold a barbaric relic.
But things changed in 07/08. Central banks were net buyers for gold again, especially emerging countries. But in the future it may be more difficult to buy gold at a reasonable price as faith in fiat currencies fades away. So at some point, central banks can embrace silver again because silver has the same properties as gold.
The only reason they were not interested in silver is because it was in their interest to hate it. But for how long? After all, it is not like having silver is new thing for them.
Read our Guide to Gold for FREE
OR … 10 ten baggers for just ten dollars
We came up with ten stocks, which have the potential to become ‘ten baggers’. Stocks that can tenfold your returns, when this market really gets going. 
We combined these 10 ten baggers is a separate report, for the symbolic low price of $10. So, 10 ten baggers for ten dollars.

Thursday, April 21, 2016

Silver’s bull run looks like it has legs.


The metal with the best return this year of any in the Bloomberg Commodity Index is poised for more gains, investors, traders and market data suggest.
“Silver has the best-looking chart among all the commodities,” said Andy Pfaff, who as chief investment officer for commodities at MitonOptimal Group in Cape Town increased his allocation to the metal over the past two weeks. “When silver moves, it really, really moves, and everyone wants to be on the right side of that trade.”
The metal is up more than 12 percent in the last two weeks after underperforming gold in the first quarter on concerns slow Chinese growth would curb demand in the biggest consumer of commodities. While both are precious metals, silver has more uses in manufacturing. Silver traded near $17 an ounce on Wednesday.
Following are charts that suggest the possibility of further gains.

Triggered Stops

Silver rallied Tuesday as big orders triggered automated short covering or stop losses, in which negative bets are closed, according to investors including Afshin Nabavi, head of trading and physical sales at MKS (Switzerland) SA.
Volumes on the Comex in New York reached about triple the 100-day average at times during the day. “We’ve seen some good fund buying that triggered stops through the recent highs in silver,” said David Govett, head of precious metals at broker Marex Spectron Group in London.

ETF Flows

Investors have been flocking to exchange-traded funds backed by silver, with holdings rising 5.6 percent this year to 19,904.1 metric tons, according to data compiled by Bloomberg as of Monday. That’s within 2 percent of a record 20,182.2 tons in October 2014.
“There seems to be a bit of momentum building in silver,” Adrian Ash, head of research at online-trading service BullionVault, said by phone from London. “When hot money is looking for a hot trade, silver is increasingly where they place their bets.”

Futures Positioning

Money managers last week increased their net-long positions by 30 percent to 54,885 contracts, the highest since comparable Commodity Futures Trading Commission data begins in 2006.

Gold-Silver Ratio

The ratio of gold to silver prices fell to the lowest level since October on Wednesday after peaking in February at the highest since 2008. It may revert back further, according to dealers such as Mark O’Byrne, a director at brokerage GoldCore Ltd. in Dublin.

Charting Course

Technical indicators are showing buy signals. The moving average convergence-divergence indicator has held above the so-called signal line since April 11, suggesting “there is more upside to silver,” said Gary Christie, a senior technical analyst at Trading Central in Ottawa.
“I wouldn’t short this,” Fain Shaffer, president of Infinity Trading Corp. in Indianapolis, said in a phone interview. “Technically and fundamentally, silver is running.”

Wednesday, March 9, 2016

This 4,000-year old financial indicator says that a major crisis is looming

Over 4,000 years ago during Sargon the Great’s reign of the Akkadian Empire, it took 8 units of silver to buy one unit of gold.
This was a time long before coins. It would be thousands of years before the Lydians in modern day Turkey would invent gold coins as a form of money.
Back in the Akkadian Empire, gold and silver were still used as a medium of exchange.
But the prices of goods and services were based on the weight of metal, and typically denominated in a unit called a ‘shekel’, about 8.33 grams.
For example, you could have bought 100 quarts of grain in ancient Mesopotamia for about 2 shekels of silver, a weight close to half an ounce in our modern units.
Both gold and silver were used in trade. And at the time the ‘exchange rate’ between the two metals was fixed at 8:1.
Throughout ancient times, the gold/silver ratio kept pretty close to that figure.
During the time of Hamurabbi in ancient Babylon, the ratio was roughly 6:1.
In ancient Egypt, it varied wildly, from 13:1 all the way to 2:1.
In Rome, around 12:1 (though Roman emperors routinely manipulated the ratio to suit their needs).
In the United States, the ratio between silver and gold was fixed at 15:1 in 1792. And throughout the 20th century it averaged about 50:1.
But given that gold is still traditionally seen as a safe haven, the ratio tends to rise dramatically in times of crisis, panic, and economic slowdown.
Just prior to World War II as Hitler rolled into Poland, the gold/silver ratio hit 98:1.
In January 1991 as the first Gulf War kicked off, the ratio once again reached 100:1, twice its normal level.
In nearly every single major recession and panic of the last century, there was a sharp rise in the gold/silver ratio.
The crash of 1987. The Dot-Com bust in the late 1990s. The 2008 financial crisis.
These panics invariably led to a gold/silver ratio in the 70s or higher.
In 2008, in fact, the gold/silver ratio surged from below 50 to a high of roughly 84 in just two months.
We’re seeing another major increase once again. Right now as I write this, the gold/silver ratio is 81.7, nearly as high as the peak of the 2008 financial crisis.
This isn’t normal.
In modern history, the gold/silver ratio has only been this high three other times, all periods of extreme turmoil—the 2008 crisis, Gulf War, and World War II.
This suggests that something is seriously wrong. Or at least that people perceive something is seriously wrong.
There are so many macroeconomic and financial indicators suggesting that a recession is looming, if not an all-out crisis.
In the US, manufacturing data show that the country is already in recession (more on this soon).
Default rates are rising; corporate defaults in the US are actually higher now than when Lehman Brothers went bankrupt back in 2008.
These defaults have put a ton of pressure on banks, whose stock prices are tanking worldwide as they scramble to reinforce their balance sheets against losses.
I just had a meeting with a commercial banker here in Sydney who told me that Australian regulators are forcing the bank to increase its already plentiful capital reserves by over 40% within the next several months.
This is an astonishing (and almost impossible) order.
The regulators wouldn’t be doing that if they weren’t getting ready for a major storm. So even the financial establishment is planning for the worst.
Good times never last forever, especially with governments and central banks engineering artificial prosperity by going into debt and printing money.
These tactics destroy a financial system. And the cracks are visibly expanding.
So while the gold/silver ratio isn’t any kind of smoking gun, it is an obvious symptom alongside many, many others.
Now, the ratio may certainly go even higher in the event of a major banking or financial crisis. We may see it touch 100 again.
But it is reasonable to expect that someday the gold/silver ratio will eventually fall to more ‘normal’ levels.
In other words, today you can trade 1 ounce of gold for 80 ounces of silver.
But perhaps, say, over the next two years the gold/silver ratio returns to a more historic norm of 55. (Remember, it was as low as 30 in 2011)
This means that in the future you’ll be able to trade the 80 ounces of silver you acquired today for 1.45 ounces of gold.
The final result is that, in gold terms, you earn a 45% “profit”. Essentially you end up with 45% more gold than you started with today.
So bottom line, if you’re a speculator in precious metals, now may be a good time to consider trading in some gold for silver

Friday, March 4, 2016

Gold-Silver Ratio Breakout Report, 28 Feb, 2016

The gold to silver ratio moved up very sharply this week, +4.2%. How did this happen? It was not because of a move in the price of gold, which barely budged this week. It was due entirely to silver being repriced 66 cents lower.
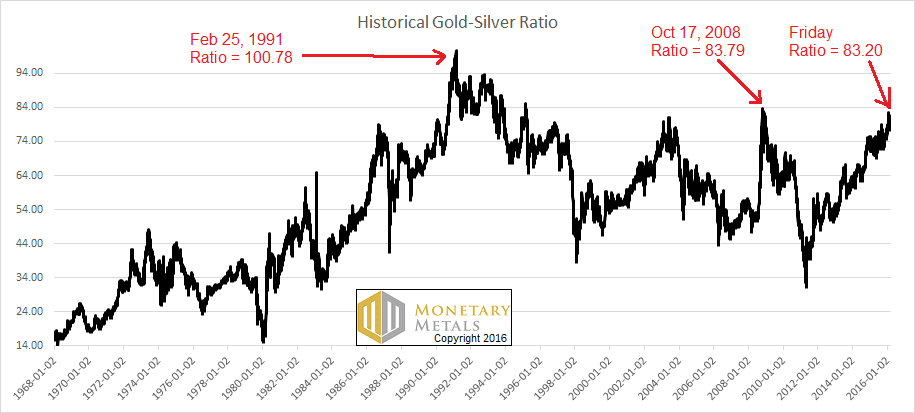
This ratio is now 83.2. It takes 83.2 ounces of silver to buy an ounce of gold. Conversely, it takes 1/83.2oz (about 0.37 grams) of gold to buy an ounce of silver.
This ratio is now within a hair’s breadth of breaking out past the high set on Oct 17, 2008. See the historical graph (based on LBMA silver fix and PM gold fix data, provided by Quandl).
The Historical Ratio of the Gold Price to the Silver Price
letter feb 28 historical ratio
Monetary Metals has been predicting a ratio well over 80 for a long time. And for two months, we have been calling for it to go much higher still. Could there be a correction? Absolutely. Could the fundamentals change? We expect they will—at some point. We will call that when we see it.
Speaking of the fundamentals, read on for the only true picture of the gold and silver supply and demand fundamentals…
But first, here’s the graph of the metals’ prices.
The Prices of Gold and Silver
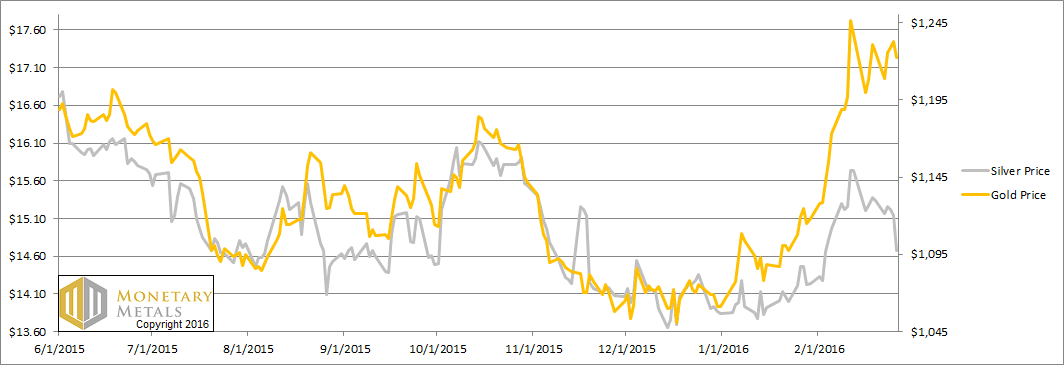
letter feb 28 prices
We are interested in the changing equilibrium created when some market participants are accumulating hoards and others are dishoarding. Of course, what makes it exciting is that speculators can (temporarily) exaggerate or fight against the trend. The speculators are often acting on rumors, technical analysis, or partial data about flows into or out of one corner of the market. That kind of information can’t tell them whether the globe, on net, is hoarding or dishoarding.
One could point out that gold does not, on net, go into or out of anything. Yes, that is true. But it can come out of hoards and into carry trades. That is what we study. The gold basis tells us about this dynamic.
Conventional techniques for analyzing supply and demand are inapplicable to gold and silver, because the monetary metals have such high inventories. In normal commodities, inventories divided by annual production (stocks to flows) can be measured in months. The world just does not keep much inventory in wheat or oil.
With gold and silver, stocks to flows is measured in decades. Every ounce of those massive stockpiles is potential supply. Everyone on the planet is potential demand. At the right price, and under the right conditions. Looking at incremental changes in mine output or electronic manufacturing is not helpful to predict the future prices of the metals. For an introduction and guide to our concepts and theory, click here.
Next, this is a graph of the gold price measured in silver, otherwise known as the gold to silver ratio. The ratio was up substantially.
The Ratio of the Gold Price to the Silver Price
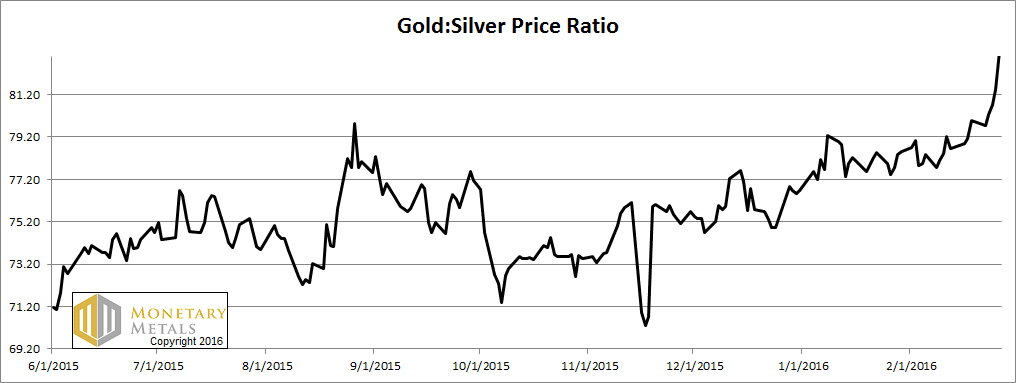
letter feb 28 ratio
For each metal, we will look at a graph of the basis and cobasis overlaid with the price of the dollar in terms of the respective metal. It will make it easier to provide brief commentary. The dollar will be represented in green, the basis in blue and cobasis in red.
Here is the gold graph.
The Gold Basis and Cobasis and the Dollar Price
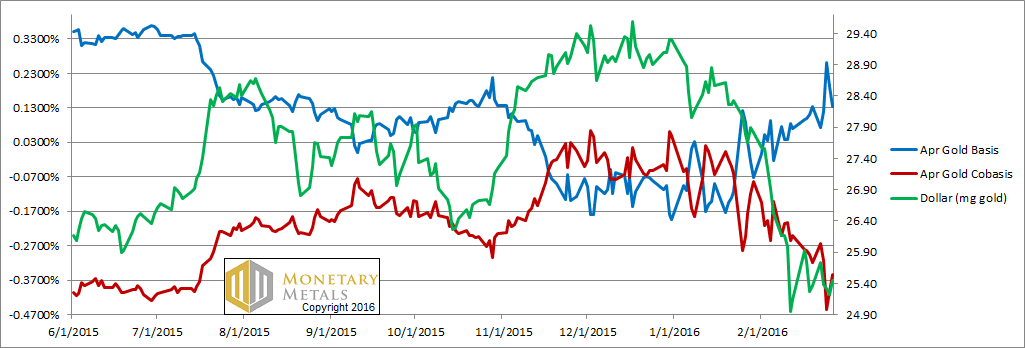
letter feb 28 gold
The price was basically unchanged. The cobasis (i.e. scarcity) was also just about unchanged. This, by the way, was also true for farther-out contracts although we only show April in this free Report.
We calculate a fundamental gold price of over $1,440. This is the price we would have if the price effect of speculation was subtracted out of the market. Who would be shorting gold at this point? We have an idea of one group that may appear sacrilegious to the gold community.
Let’s get it out of the way. No, it’s not the Powers That Be, the commercial banks, the central banks, or the Illuminati. It’s the silver bugs. Consider the widespread belief—at least outside of readers of this Report—in silver outperformance. Who doesn’t think the ratio should be far lower—50 for starters, on the way to 16 as in Ye Times of Olde?
How would you trade this thesis? You would short gold futures and go long silver futures in equal dollar amounts. This would of course push up the price of silver, and push down the price of gold
We would say to anyone in this trade to be careful, but obviously they don’t read this Report. If you must trade this trend, you should do the opposite: long gold, short silver (and be wary of violent corrections).
How do we explain that the price of gold is 15% below its fundamental, while the price of silver is only at a 2% premium? The silver market is less liquid than the gold market, so equal dollar values of this trade would push the silver price up more than it would push the gold price down.
We have two thoughts on this. One, if most traders think of the metals as commodities—we saw yet another article on this theme today—and if commodities are in a bear market, then the metals are hated. Perhaps silver would be 30% under its fundamental—i.e. about $10—if it weren’t for this trade that alters the relationship of silver to gold.
Maybe. Our other thought is that if this is a new bull market in gold—i.e. a bear market in the dollar—it’s in stealth mode at the moment. Mainstream traders are not excited about gold speculation. They’re not buying gold futures, and may even be short. We are aware of the Commitment of Traders report (COT), showing that non-commercials (i.e. speculators) have a net long position. It’s the commercials (i.e. miners and jewelers) who have the short position. Perhaps it’s the miners putting on more hedges—i.e. selling more of their production forward. Maybe it’s the reduced forward buying of the gold users.
Whatever the factors, one thing’s for sure. The price of gold in the futures market is sagging relative to the price of gold in the spot market.
Our approach is not based on aggregate quantities. That’s why we don’t stop at the COT data. We look at spreads. Spreads inform us in a way that strict quantity analysis cannot. If you doubt this, ask how many COT analysts predicted the price action in silver or the ratio.
This graph shows the rates we observe to carry gold for contracts in 2016 (i.e. basis).
The Gold Bases for 2016 and LIBOR
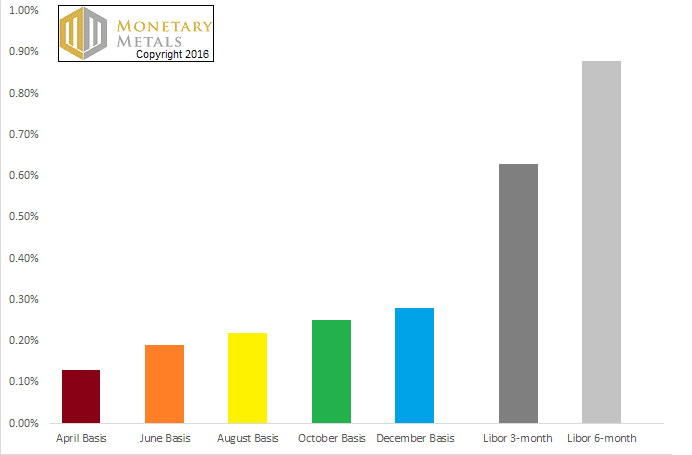
letter feb 28 basis libor
These yields are hardly worth anyone’s while to buy gold and sell a future against it, not to mention that the cost of funding this trade is about twice the return on the trade. Carrying gold does not pay, because gold is not abundant enough in the market to be available to carry.
Now let’s look at silver.
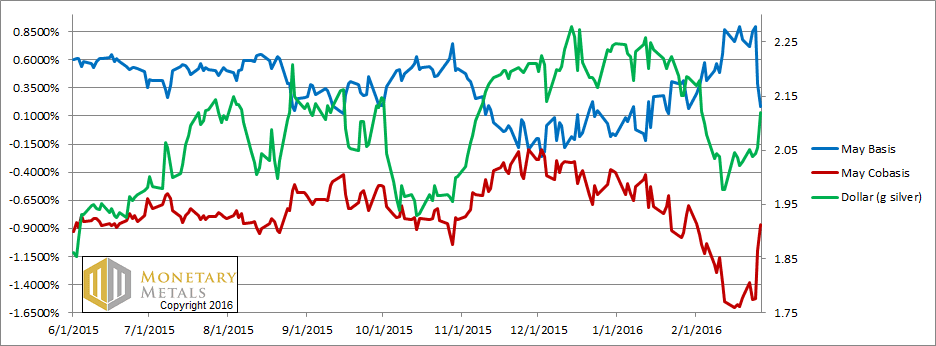
The Silver Basis and Cobasis and the Dollar Price
letter feb 28 silver
In May silver, we see the scarcity (i.e. cobasis) drops on Tuesday when the price of the dollar falls (i.e. the price of silver rises), and a rising scarcity as silver is becoming cheaper. It’s no surprise that the big rise in scarcity occurred on Friday, with the big drop in price. No question, futures sold off.
Another glance confirms it. Look at the epic drop in the basis. It’s down almost to match the gold basis (though the cobasis is nowhere near what is in gold). To review, here are our definitions:
Basis = Future(bid) – Spot(ask)
Cobasis = Spot(bid) – Future(ask)
The basis is down because the bid on the May contract is being pressed down. Silver—at this price—is no longer so abundant. The basis is well below LIBOR. However, it’s not particularly scarce. The ask on the May contract is still strong, still being lifted by buying pressure.
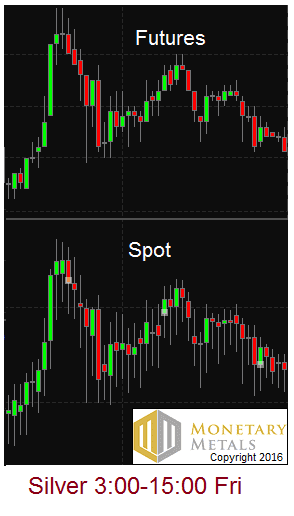
Last week, we showed a picture of “icicles” dripping on the chart of spot silver.
letter feb 21 silver icicles
This is in contrast to the futures chart. First, thanks to several folks who wrote to say that these are usually called “shadows”. We used the term icicle because of its connotation of dripping down. We believe that the cause is that metal is being sold, pushing the price down. But then that creates an actionable arbitrage to carry silver. So the market makers buy spot and sell the future. This does two things. One, obviously, it records a trade in the spot market at ask price and lifts the ask. Two, it presses the bid price in the futures market.
If this is correct, then silver is intermittently abundant. At times when there’s selling of metal in the spot market, it’s abundant enough to go into the warehouse. At other times, and we’ll see more of this if the price falls further, it’s not so abundant.
The fundamental price of silver fell about a nickel this week. The market price is much closer to the fundamental now.
This brings us to the ratio. The fundamental on the ratio hit over 100 this week.
What does it mean that the market ratio is just about to break out past its 2008 high, while the fundamental is predicting we could hit the record set in 1991? Ironically, the gold-silver ratio is showing something that most mainstream signals cannot.
The seasonally adjusted unemployment number looks brilliant at under 5%. The S&P 500 index of stocks is only about 10% off its highs from the first half of last year. Sure, there’s that epic collapse in the price of crude oil and other commodities, but pay no heed. Cheap oil means cheap gas which gives money back to consumer who can spend spend spend our way to prosperity.
The gold to silver ratio is showing us that the junior money is getting cheaper relative to the senior money. It is showing us that the metal which has industrial demand as well as monetary is falling relative to the metal whose demand is entirely monetary. It is also showing us that tightening credit conditions are starting to matter. So far as silver is concerned, credit conditions today match those which existed in October 2008.

Monday, February 1, 2016

Legendary Investor Eric Sprott Shares the Greatest Financial Lesson He’s Ever Learned

In the wake of Japan announcing negative interest rates and chaos in the silver market with Thursday’s LBMA silver price fix smashed .84 below spot prices by the 6 fixing bullion banks, we welcomed The Admiral of the Silver Market, Eric Sprott himself to help us break down all the action. In Sprott’s words, the sheer brazenness of the silver fix smash “Reeks of Desperation“.
The discussion offers a unique look into the mind of the Billionaire Asset Manager, as Sprott shares insight into the thought process on how he evaluates whether a market is experiencing a bottom, and the legendary investor also shares the greatest financial lesson he’s ever learned…

  • Sprott Breaks Down London Fix Silver Manipulation: It Reeks of Desperation!  The sheer brazenness to think you can just put out whatever price you want…
  • How Does Sprott Evaluate if a Market Bottoming Process is Underway?
  • With the Value of the CAD Plunging, Have Canadians Started Turning to Gold & Silver For Wealth Preservation?
  • Sprott Warns on Systemic Collapse: We Were Right There in ’08, Here We Are 8 Years Later, & the Situation is Worse!
  • Sprott Reveals Gold and Silver Demand is WAY Off the Charts- Shortages Are Popping Up Again!
  • COMEX Down to 2 Tonnes of Gold- Will Eric Soon Be Able to Take the Last Physical Gold Bar out of the COMEX?
There’s an old saying on Wall Street.  The first five trading days of January often sets the tone for the rest of the year.  Think of it as trader folklore, and historically, there is some truth to the pattern.
Well, to heck with the first five trading days.  January’s stock market action has been downright ugly!  If it wasn’t for the Bank of Japan’s announcement of negative interest rates on Thursday and the Pavlovian ringing of the global liquidity bell, we wouldn’t have seen the S&P 500 gain 2.43 percent on Friday’s close.  That gain repaired some of the mauling sustained by the benchmark.  Nevertheless, carnage this January was exceeded only by the downside action of January, 2009.
sp-500
I’ve warned many times this month on Weekly Metals & Markets as well as on Dr. Dave Janda’s show that we’re most likely going to see an ongoing bear market decline that takes time to unfold, not unlike the 2000 through 2002 and 2007 (in select assets) through the March, 2009 nadir.  Spike-down crashes are possible.  But an ongoing bear market, with plenty of “normal” bear market rallies is more common than spike down events like Oct., 1987.  In fact, don’t be surprised if we see the S&P 500 rise, on balance, during the month of February.  It’s ripe for a bounce, and with the Bank of Japan upping stimulus, the spice will flow;  more global liquidity is coming, and “Super Mario” already “surprised” the markets with a doubling down on his “whatever it takes” mantra.
Frankly, while I can’t prove this, I think it’s a reasonable speculation to assume that the Bank of Japan is playing its role, taking its turn drinking from the “currency war canteen,” as Jim Rickards likes to joke.  It’s reasonable to assume the BOJ’s action last night is fully coordinated with the ECB, the Fed and the Bank of England.  You can probably toss into the mix the Swiss National Bank and the Bank for International Settlements as well.
dollar index
The strong US dollar has been contributing to global deflationary forces upsetting financial markets.  The transmission mechanism takes many forms, including the impact to oil (and in turn, degrading balance sheets of energy companies), and to the dollar denominated debt burden faced by developing countries that piled on debt after the Fed led the world down the path towards our zero interest rate paradigm.  This debt doubles as collateral on the balance sheets of energy companies, and the treasuries/central banks of developing countries.  In a roundabout way, the rising dollar is sending earthquakes through the global shadow banking system and financial markets.
yen to dollar
euro to dollar
The dollar took a breather during early January.  But as you’d expect, the dollar leaped higher today in relation to the Japanese Yen.  Interestingly enough, the Euro also rose against the US Dollar – and has been rising over the last few trading days.  There’s every reason to expect the dollar to keep rising in the short-term, and this is going to probably put pressure on precious metals, quoted in US dollar terms.  But everywhere one looks, incoming economic data paints a picture of the US having already entered a recession.  Even official government stats paint this picture.  At some point, the “currency war canteen” is going to be passed to the US and the Fed is going to take a swig.  The reality of this transition will start to be priced into markets before Janet Yellen reaches for the liquidity canteen, and I expect this shift to start helping precious metals with a dollar tailwind starting within a couple of months.
But well before the dollar tailwind starts to help, we’ve got plenty of forces countering the dollar’s impact.  The laws of economics haven’t been repealed, and the supply/demand trends for physical metal Mr. Sprott discusses will pull the sector higher.  But don’t be surprised if we have another few months of cartel management and a generally stronger dollar before precious metals start to make a sustained move higher.

Tuesday, December 22, 2015

金銀市短期再陷反复

加息金價跌」,人們普遍認為是真理,其實這並非真理,不過在當前卻可能是真理。

《華爾街日報》最近一句話反映大多數人的共識︰向更高息率的轉移,預期會傷害金價,持有黃金無利息且有保管成本。然而,歷史告訴我們,在美國利率上升時期,金價實際上大多數是上升的。

兩 者同步最典型是在1972至1975年,尤其是1976年秋至1980年初期間,金價與美國聯邦基金利率呈正相關關係,兩者同向上升。令人最難忘的是在 1980年1月基金利率升至17.5厘高水平,金價則創出當時歷來最高價850美元。可是,美國利率與金價的同向關係並非固定。 2001至2004年,在聯邦基金利率下跌期間,金價報升。在2004至2007年期間,聯邦基金利率回升,金價卻繼續上升。到2007至2010年秋, 美國利率持續大幅下降到接近零的水平,金價與之呈明顯的負相關關係,漲升到新的歷史高位1923美元。

實質利率才是關鍵

然 而此後,由2011年到最近,聯邦基金利率維持在接近零的水平,金價卻從高峰反復回落,最近曾見1045美元,跌幅達45.6%。上週聯儲局把聯邦基金利 率調升0.25厘,並表示將會循序漸進再加息,揭開了加息週期帷幕。此時不少外國分析嘲笑「加息金價跌」的共識,指出這是錯誤觀念,認為日後將如過去大多 數時間一樣,金價將隨利率回升而上升。不過,另有分析者提出異議,其所持理據當然不是低層次的「人們共識」,而是影響金價的不是名義利率,而是實質利率 (即名義利率減去通脹率)。
七十年代,由於通脹惡化,儘管名義利率不斷調升,但仍趕不上通脹上升的速度,以致實質利率兩度低於負5厘水 平,造成金價與名義利率同升。 2009至2011年,名義利率被調低至零水平,造成實質利率處於負值狀態,金價遂與名義利率背馳而大升。其後聯邦基金利率雖然幾無變動,但因通脹率下 滑,實質利率從負3.5厘水平回升,金價故從高峰反復回落。

上週名義利率提升了,但商品價格依然下滑,這使實質利率約有正0.7厘的水平,諒金價難以隨同利率上升。

敝欄傾向後一派的觀點,即視為未來一段時間,金價難以伴隨名義利率同升。

金價守1045 銀市14.4遇阻

不 過上述爭議仍持續,市場看法亦不一致,體現於上週聯儲局議息前後的市況上下波動。週四金價一度跌回到1046.8美元,僅略高於本月初的最低點 1045.4美元,然而,在此觸發淡倉再回補及部分新買盤入市。技術上的可能雙底亦引起牛派的憧憬,除了期金市的未平倉合約量大幅回增外,週五SPDR持 金量亦從630.17噸回增至648.91噸。

美元回順而美債價回升是有利因素。因此,敝欄在認為金市中長期未轉勢的前提下,估計短期金價可守住1045美元,而不致進一步跌至1035元,且支持暫上移至1052美元;但在1080美元會有阻力,較大的阻力仍在1097美元。換言之,金市續在近兩月低位反复。

銀 市上週曾創大調整市的新低13.62美元,但守住敝欄上期估計的支持13.5美元。上周銀市反复劇烈程度勝金市,有人認為銀市的值博率更高,但對沖基金的 淨沽倉量再創此項新紀錄。現估計銀市的支持仍分別在13.5美元及13.65美元,且暫上移至13.8美元;但在14.4美元會有阻力,較大阻力仍為 14.7美元。

金銀兩市尚未見大量新資金流入,在交投較淡靜的聖誕節前夕,或有頗飄忽的行情出現。


Wednesday, October 1, 2014

深度解讀:現在我買白銀的7大原因


  來源:中國黃金網  作者:傑夫·克拉克 覃維桓/譯 

以現價買入白銀,可能會是一個改變人生的投資。
  這不僅是因為白銀的工業用途不斷增長,或者爆炸性的光伏(太陽能)需求,甚至也不是預計2014年的供應量將停滯,僅能達到2010年的水平。而在於各國政府選擇印鈔、赤字開支和不停地增加債務,已經證明世界領導者們要打破他們的習慣太難了。在這一點上,美國和世界各地其他國家的政府都如此。美聯儲和其國際央行的同行提供貨幣用於高速運轉,盡管美聯儲最近在縮減購買債券的規模,過去的行為後果並未因此而消失。由央行進行的虛擬刺激和操縱最終將導致系統性崩潰。
  當政府財政被迫進入撤退,隨之而來的危機將湧入貴金屬。當資產被視為安全的今天,債券和美元進入熊市或完全崩潰的局面將會加劇。
  這樣以來,白銀價格從目前的水平崛起,不會是10%或20%,而是兩倍、三倍或更多。
  如果通脹大幅上升,銀價到每盎司100美元不是幻想,而有著很大的可能性。黃金當然也將受益,但由於白銀的波動性較高,預計會給我們更高的回報率,像過去很多次一樣。
  最終,所有的市場修正過度。全球經濟正接近一個臨界點,我們必須在出現混亂之前,現在就對我們的投資組合做好準備,這包括擁有有意義數量的實物白銀與黃金。
  是等待一個大收獲的時候了。
  讓我們先忽略短期因素,如凈長、短倉位,交易所交易基金(ETF)周持倉的波動,或最新的期貨持倉量。這些數據經常波動,很少與白銀的價格有長期的關聯。
  我更感興趣的是可能在未來數年影響白銀的大形勢。當然,最顯著的力量就是我上面所說的:政府印鈔和赤字,這將不可避免地在世界各地許多國家導致貨幣危機,推動白銀和黃金價格到創紀錄的水平。
  在歷史上任何時候政府都沒有印過這麽多錢。在世界上沒有一種貨幣與黃金或任何其他實物相掛鉤。這一前所未有的設置意味著災難性後果,將是歷史性的,並影響我們每一個人。
  具體到銀本身,下面就是告訴我“大事將要發生”的數據……
  通脹調整後價格還有很長的路要走
  白銀潛力的線索之一是它經通貨膨脹調整後的價格。
  下面顯示的是銀價根據勞動統計局的CPI-U數據和從1980年以來CPI-U的公式調整過的銀價(調整公式已經被調整多次,以保持通脹數目盡可能地低)。

  銀價遠低於經通脹調整過的價位
現在我買白銀的7大原因
  根據當前的CPI-U的計算,2011年4月48美元的高峰只是通貨膨脹調整後1980年1月價格的不到一半。如果用1980年的公式來衡量通貨膨脹,白銀將需要達到每盎司470美元才能越過該峰值。
  我不認為白銀會漲到那麽高(至少我希望不會,因為我覺得漲到那麽高,會有太多人被犧牲),但很明顯,賠率是偏向上行,並有很大的上漲空間。
  白銀價格與生產成本
  生產商被迫降低成本,因為去年的白銀價格暴跌。有些人在這方面比別人做得更好,但還是檢查出利潤率收窄。

  銀價相對於生產成本大幅下降
現在我買白銀的7大原因
  相對於生產成本,白銀價格正處於2005年以來最低水平。請記住,現金成本在所有成本中只是一部分,而白銀價格在歷史上交易遠高於這個值(總成 本只是現在才被廣泛報道)。利潤率收縮得那麽厲害,在長期的基礎上是不可持續的,必然會影響這個行業。這也使得價格可能已經觸底,因為生產商把開支削減了 這麽多。
  大約75%的白銀是作為一種副產品被生產出來,價格取決於利潤;如果一個礦無法經營獲利或新的項目不能以低廉的價格獲得利潤,所造成的產量下降必將作為更高價格的催化劑。此外,目前大部分成本削減主要來自削減勘探預算,這將削弱未來的供應。
  低庫存
  各種實體持有銀條存貨,而美國鑄幣含銀水平是很高的。由於幾十年來用於流通的所有美國硬幣改為用基本金屬鑄造了,因此今日對高庫存的需要降低了。但是這個圖表顯示的是庫存是多麽少。

  白銀大多存放在ETF基金手裏
現在我買白銀的7大原因
  你可以看到當前庫存與歷史相比是多麽低,大部分被交易所交易產品持有。這一點很重要,因為這些投資者自2005年以來就是凈買家,因此一直保持 這些金屬遠離市場。當前庫存剩余量為2.41億盎司,只有一年供應的25%,而在1990年,相當於當前供應的大約8倍。如果需求突然暴增,這些需求無法 通過現有庫存滿足。事實上,交易所交易產品(ETP)的投資者可能讓更多的金屬離開了市場(以下簡稱“隱含的未報告的庫存量”,是指世界各地的私人和其他 未報告的存量,另一個驚人的數量較少)。
  如果投資需求重復2005年到2009年的激增,這將使供應方不能出現一點閃失。
  熊市結束
  60年來的熊市走到底的市場信號表明,我們的熊市即將耗盡。黑線代表銀價自2011年4月到2014年8月8日的下降。

  白銀熊市結束了?
從歷史記錄來看,現在購買白銀風險較低。
從歷史記錄來看,現在購買白銀風險較低。
  相對於其他商品便宜
  以下是白銀價格與其他貴金屬和最常見的基本金屬的價格對比。
只有鎳離歷史最高價更遠。
只有鎳離歷史最高價更遠。
  主流資金低參與
  白銀潛力另一個指標是占全球金融財富的比例與白銀在1980年創下50美元價格時所占的百分比相比較。

  白銀在全球金融財富中所占的比例很小
盡管對實物金屬持續強勁的需求,目前白銀只占世界金融財富的0.01%。這是1980年水平的二十五分之一。即使與我們在2011年看到的那個價格大殺跌相比,也簡直是小巫見大巫。
  盡管對實物金屬持續強勁的需求,目前白銀只占世界金融財富的0.01%。這是1980年水平的二十五分之一。即使與我們在2011年看到的那個價格大殺跌相比,也簡直是小巫見大巫。
  還有巨大的空間使白銀成為主流投資組合的更大部分。
  關註中國!
  正在從西方轉移到東方的,不只是黃金……

  中國的白銀期貨成交量在爆炸
現在我買白銀的7大原因
  上海期貨交易所已經超過了紐約商品交易所,成為全球最大的白銀期貨交易所。事實上,去年上海期貨交易所占了全部成交量的48.6%。同時,紐約商品交易所期貨在急劇下降,從近在2001年93.4%的市場份額,下降到今天的不到一半。
  所有交易導致了交易所白銀庫存銳減。由於在COMEX大多數銀(金)的合同是以現金支付,而多數在上海交易所的合約用實物金屬結算。這導致了銀庫存的巨大流失...

  上海交易所白銀庫存位於歷史低位
自2013年1月以來,上海期貨交易所的白銀庫存大幅減少了84%,達到創紀錄的148噸低位。如果這種趨勢持續下去,中國的交易所在不遠的將來,將遭遇嚴重的供應短缺。
  中國國內白銀供應(礦山產量、進口量和回收量)有望創下歷史新高,並在今年超過2.5億盎司。相比之下,2000年還只有不到7000萬盎司。實際上幾乎沒有出口,因而無法被世界市場利用。
  中國投資者估計在2013年已購買2200萬盎司白銀,為僅次於印度的第二大金額。而在1999年為零。
  白銀應用最大的百分比增長來自中國。攝影、珠寶首飾、銀器、電子、電池、太陽能電池板、釬焊合金、生物殺滅劑的使用都在中國以比世界上任何其他國家更快的速度不斷增加。
  這些是我買入白銀的最主要原因。
  不得不承認,在未來的幾年對白銀投資者來說,可能是一個非常激動人心的時刻。
  就像黃金,我們收藏白銀將幫助我們保持生活水平,但可能更切合實際的使用,因為銀價低,可以用於少量采購。而在高通脹/美元衰敗的情況下,銀價很可能超過消費物價通脹,給我們更多的購買力保障。
  底線是,目前銀價應該被看作是一個長期的買入機會。這可能會或可能不會是我們在這個價位上在這一周期購買的最後機會,但如果你喜歡便宜貨,白銀的 “減價大甩賣!”的標誌霓虹燈已經像一個迪斯科球在閃爍。


http://gold.hexun.com.tw