Wednesday, March 23, 2016

AirAsia in good financial position

aireen_airasia_fd_230316Aireen (left) at the send-off ceremony of AirAsia’s inaugural flight from Penang to Yangon, Myanmar.
BAYAN LEPAS (Penang): AirAsia Bhd is in a good financial position for its upcoming financial year ending Dec 31, 2016 (FY16), thanks to low crude oil prices and the timeliness of the airline’s hedging practices against the commodity.
Its chief executive officer (CEO) Aireen Omar reiterated the statement made by AirAsia’s group CEO Tan Sri Tony Fernandes, which was reported in The Economic Times of India, that oil prices, which are currently trading at levels of US$41.54 (RM166.16) for Brent Crude Futures, “will stay where it is”.
Fuel costs account for a significant portion of AirAsia’s operational cost, therefore, lower prices will help enhance the airline’s profitability.
“We are confident of good [financial] growth in 2016; low oil prices are fantastic for operations, and the fact that we didn’t hedge a lot earlier before the oil prices came off resulted in us not being subjected to high hedges, unlike other airlines, “ she told reporters at a news conference yesterday in conjunction with Air Asia’s inaugural flight from Penang to Yangon, Myanmar.
For FY15, AirAsia’s net profit grew more than sixfold to RM540.96 million from RM82.8 million in FY14, while revenue came in at RM6.3 billion in FY15, up 16.3% from RM5.4 billion the previous year.
AirAsia has also been vocal in its dissatisfaction with the operating conditions at klia2, which is operated by Malaysia Airports Holdings Bhd (MAHB).
On July 31 last year, the low-cost carrier issued a letter of demand to MAHB and its subsidiary Malaysia Airports (Sepang) Sdn Bhd , seeking RM409 million for losses and damages as a result of its operations at the new budget terminal klia2 as well as from the earlier low-cost carrier terminal (LCCT) in Sepang.
Malindo Air, which was also a tenant at klia2, had moved its operations to KLIA effective from March 15 this year.
“The number of passengers per day departing from klia2 only coming from AirAsia averages to about 37,000 per day, and 45,000 per day during the peak periods ... if you include both arrivals and departure during the peak period you’re looking at around 80,000 passengers per day, so there is huge volume there,” said Aireen.
With the commencement of its inaugural flight to Yangon yesterday, AirAsia now services seven international destinations via its northern hub of Penang.
http://www.theedgemarkets.com/my/article/airasia-good-financial-position

Wednesday, March 16, 2016

Top 400 Billionaires’ Wealth Rises to $3.896 Trillion

The Bloomberg Billionaires Index takes measure of the world’s wealthiest people based on market and economic changes and Bloomberg News reporting. Each net worth figure is updated
===============================================================================
                                                   Daily  Daily     YtD  Prev.
Rank     Name                              US$ B    $Chg   %Chg    $Chg   Rank
===============================================================================
    Top 400 Total                         $3,896   14.3B   0.4%  -23.6B    n/a
-------------------------------------------------------------------------------
1   William Henry Gates III "Bill"         $83.3   80.3M   0.1% -470.1M      1
2   Amancio Ortega Gaona                   $71.1  284.3M   0.4%   -1.7B      2
3   Warren E Buffett                       $65.9 -219.1M  -0.3%    3.6B      3
4   Carlos Slim Helu                       $55.2 -653.7M  -1.2%    2.9B      4
5   Charles De Ganahl Koch                 $51.4  -48.0M  -0.1%    3.2B      5
6   David Hamilton Koch                    $51.4  -48.0M  -0.1%    3.2B      5
7   Jeffrey P Bezos "Jeff"                 $51.1  383.9M   0.8%   -8.6B      7
8   Mark Elliot Zuckerberg                 $47.6  262.2M   0.6%    1.8B      8
9   Ingvar Kamprad                         $41.9   80.5M   0.2%    2.0B      9
10  Lawrence Joseph Ellison "Larry"        $41.0 -174.5M  -0.4%    1.3B     10
11  Lawrence E Page "Larry"                $38.8  339.4M   0.9%   -1.1B     11
12  Sergey Brin                            $38.0  217.7M   0.6%   -1.2B     12
13  Bernard Arnault                        $34.8  221.7M   0.6%    2.9B     13
14  Liliane Bettencourt                    $34.4  189.2M   0.6%    1.3B     14
15  Jim C Walton                           $33.0  250.2M   0.8%    2.5B     15
16  Samuel Robson Walton                   $32.7  251.3M   0.8%    2.7B     16
17  Alice Louise Walton                    $32.2  250.4M   0.8%    2.7B     17
18  Jacqueline Badger Mars                 $31.4  123.2M   0.4% -913.7M     18
19  John Franklyn Mars                     $31.4  123.2M   0.4% -913.7M     18
20  Forrest Edward Mars Jr                 $31.4  123.2M   0.4% -913.7M     18
21  Wang Jianlin                           $29.5  624.1M   2.2%   -7.0B     21
22  Li Ka-Shing                            $29.1  319.6M   1.1% -870.6M     22
23  Jack Yun Ma                            $27.9  -19.7M  -0.1%   -1.8B     23
24  Jorge Paulo Lemann                     $27.1   31.3M   0.1% -564.7M     24
25  Sheldon Gary Adelson                   $26.7  380.0M   1.4%    3.7B     25
26  Stefan Persson                         $25.8  270.4M   1.1% -397.6M     27
27  Philip H Knight "Phil"                 $25.7  251.3M   1.0%  380.9M     26
28  George Soros                           $24.4     n/a    n/a     n/a     28
29  Steve Ballmer                          $23.1  178.2M   0.8% -803.5M     29
30  Giovanni Ferrero                       $21.9  -21.4M  -0.1% -489.0M     30
31  Mukesh D Ambani                        $21.4   33.3M   0.2% -213.4M     31
32  Georg F W Schaeffler                   $20.5  210.3M   1.0%   -2.0B     34
33  Carl C Icahn                           $20.5  -72.8M  -0.4%  564.8M     32
34  Hrh Prince Alwaleed Bin Talal Al Saud  $20.2 -287.0M  -1.4%   -4.7B     33
35  Dieter Schwarz                         $19.2  202.3M   1.1%    1.0B     35
36  Ma Huateng                             $19.2  597.0M   3.2%  -56.4M     37
37  Leonardo Del Vecchio                   $18.9  -43.2M  -0.2%   -3.1B     36
38  Elaine Tettemer Marshall               $18.1  -16.7M  -0.1%    1.4B     38
39  Paul Gardner Allen                     $17.9   30.7M   0.2% -249.4M     39
40  Laurene Powell Jobs                    $17.6  177.8M   1.0% -852.7M     40
41  Dr Lee Shau Kee                        $17.2  471.0M   2.8% -319.6M     44
42  Len Blavatnik                          $17.1 -174.0M  -1.0% -104.5M     41
43  Thomas Peterffy                        $16.9  -14.6M  -0.1%   -1.4B     43
44  Dilip Shantilal Shanghvi               $16.8 -154.9M  -0.9%  334.2M     42
45  Donald Leroy Bren                      $16.5   25.0M   0.2%     n/a     45
46  Tadashi Yanai                          $16.5  787.8M   5.0%   -1.7B     48
47  Michael S Dell                         $16.3     n/a    n/a   -1.5B     46
48  Alejandro Santo Domingo                $16.1  -48.7M  -0.3%  213.6M     47
49  Dr James Harris Simons "Jim"           $15.5     n/a    n/a     n/a     49
50  Charles W Ergen "Charlie"              $15.2 -117.3M  -0.8%   -1.7B     50
51  Serge Dassault                         $15.0 -116.0M  -0.8% -882.9M     51
52  Alhaji Aliko Dangote                   $14.7 -150.4M  -1.0% -543.3M     52
53  Robert Kuok Hock Nien                  $14.5  119.0M   0.8%  937.9M     54
54  Vladimir Potanin                       $14.4   -3.3M   0.0% -268.4M     53
55  Azim Hasham Premji                     $14.2    7.8M   0.1% -690.4M     55
56  Raymond T Dalio "Ray"                  $14.1     n/a    n/a     n/a     56
57  Ernesto Bertarelli                     $14.1    1.3M   0.0%  -39.4M     57
58  Ronald Owen Perelman                   $14.0  -79.4M  -0.6%  227.9M     58
59  Gerald Cavendish Grosvenor             $13.9     n/a    n/a -165.0M     59
60  Susanne Klatten                        $13.9   67.2M   0.5%   -1.3B     60
61  Francois Pinault                       $13.4   25.2M   0.2%  311.4M     61
62  Leonid Mikhelson                       $13.4    5.9M   0.0%  429.7M     62
63  Stefano Pessina                        $13.3   57.8M   0.4% -403.8M     65
64  Robin Yanhong Li                       $13.2   19.8M   0.1% -450.1M     63
65  Viktor Vekselberg                      $13.1   83.0M   0.6%  451.9M     68
66  Henry Sy Sr                            $13.0 -169.6M  -1.3%  572.2M     64
67  Pallonji Shapoorji Mistry              $13.0  -44.4M  -0.3% -848.6M     67
68  Joseph Yacoub Safra                    $13.0  -90.1M  -0.7%  428.9M     66
69  Marcel Herrmann Telles                 $12.8   21.5M   0.2% -137.2M     69
70  George B Kaiser                        $12.7   17.1M   0.1%  268.1M     70
71  Alain Ernest Wertheimer                $12.3  164.2M   1.4%  415.8M     71
72  Gerard Paul Phillipe Wertheimer        $12.3  164.2M   1.4%  415.8M     71
73  John R Menard Jr                       $12.2  114.9M   1.0% -632.8M     74
74  Stefan Quandt                          $12.2   98.6M   0.8%   -1.8B     73
75  Lukas Tyler Walton                     $12.1   81.8M   0.7%  940.4M     76
76  Mikhail Fridman                        $12.0    3.3M   0.0%  -69.3M     75
77  Steven A Cohen "Steve"                 $12.0     n/a    n/a   -5.0M     77
78  Alexey Mordashov                       $12.0  207.9M   1.8% -303.3M     79
79  Hans Rausing                           $11.9  -11.8M  -0.1% -250.2M     78
80  Lee Kun-Hee                            $11.8  200.3M   1.7%  120.4M     81
81  Petr Kellner                           $11.6  -85.4M  -0.7% -371.0M     80
82  Shiv Nadar                             $11.6   23.5M   0.2% -563.9M     82
83  Leonard Alan Lauder                    $11.5   80.4M   0.7%  563.5M     83
84  Alisher Usmanov                        $11.4  -44.4M  -0.4% -603.4M     85
85  Keith Rupert Murdoch                   $11.3   -9.2M  -0.1%   93.5M     86
86  Charlene De Carvalho-Heineken          $11.3 -130.7M  -1.1% -189.6M     84
87  John Fredriksen                        $11.1   -0.7M   0.0%  -24.2M     87
88  Elon R Musk                            $10.9  308.9M   2.9%   -1.5B     93
89  Klaus-Michael Kuehne                   $10.9   74.0M   0.7%   22.7M     89
90  Carlos Alberto Sicupira                $10.8   -7.7M  -0.1% -109.9M     88
91  Iris Fontbona                          $10.8   99.9M   0.9%  499.1M     91
92  Kjeld Kirk Kristiansen                 $10.7  -38.8M  -0.4%    2.3B     90
93  Dustin A Moskovitz                     $10.7   57.1M   0.5%  492.4M     92
94  Luis Carlos Sarmiento Angulo           $10.6    0.2M   0.0%  272.9M     94
95  Karl Albrecht Jr                       $10.6   93.6M   0.9%  702.9M     97
96  Beate Heister                          $10.6   93.6M   0.9%  702.9M     97
97  David Alan Tepper                      $10.6   27.4M   0.3% -158.3M     96
98  Roman Abramovich                       $10.5  -11.0M  -0.1% -876.3M     99
99  Philip F Anschutz                      $10.5   -0.4M   0.0%   88.3M    100
100 Georgina Hope Rinehart "Gina"          $10.5  -98.0M  -0.9%  783.8M     95
101 Prof Dr Hasso Plattner                 $10.5   95.5M   0.9%  -85.3M    103
102 Samuel Irving Newhouse Jr "Si"         $10.4  -52.8M  -0.5% -298.5M    101
103 Dietrich Mateschitz                    $10.3 -112.8M  -1.1%   -1.2B    102
104 Masayoshi Son                          $10.3  186.1M   1.8%  155.6M    109
105 Dr Eric Emerson Schmidt                $10.3  147.7M   1.5% -176.6M    107
106 Lakshmi N Mittal                       $10.2   69.4M   0.7%  815.8M    104
107 Cheng Yu-Tung                          $10.2   53.8M   0.5% -123.1M    108
108 Charoen Sirivadhanabhakdi              $10.1  -42.5M  -0.4%    1.0B    105
109 Stephen Allen Schwarzman               $10.1  -54.3M  -0.5% -277.4M    106
110 Liu Yongxing                           $10.0  176.3M   1.8% -374.9M    112
111 Mikhail Prokhorov                      $10.0   -3.2M   0.0%   30.5M    110
112 Alberto Bailleres Gonzalez              $9.9  -17.1M  -0.2%  605.8M    111
113 Dr Patrick Soon-Shiong                  $9.5   -3.8M   0.0% -728.0M    113
114 James H Goodnight "Jim"                 $9.5   59.1M   0.6% -974.7M    115
115 Donald Edward Newhouse                  $9.4  -52.8M  -0.6% -298.5M    114
116 Micky Meir Arison                       $9.4   28.6M   0.3% -485.0M    116
117 Heinz Hermann Thiele                    $9.3   32.4M   0.3% -641.0M    117
118 Patrick Drahi                           $9.3   38.0M   0.4%    1.7B    118
119 John Alfred Paulson                     $9.2   27.5M   0.3% -857.3M    119
120 Dmitry Rybolovlev                       $9.2   50.1M   0.5%  -54.1M    120
121 Kwok Ping-Luen "Raymond"                $9.2   96.9M   1.1%  144.9M    121
122 Kwok Ping Kwong "Thomas"                $9.1   96.6M   1.1%   94.2M    122
123 W G Galen Weston                        $9.0   32.2M   0.4%  698.1M    123
124 Yeung Kin-Man                           $9.0  360.3M   4.2% -843.7M    130
125 Mohammed Al Amoudi                      $9.0    5.2M   0.1%  312.8M    124
126 Jan Koum                                $8.9  -21.8M  -0.2%  142.7M    125
127 Xavier Niel                             $8.8   77.3M   0.9%  678.6M    129
128 Vladimir Lisin                          $8.8    0.9M   0.0%    1.3B    127
129 Sara Mota De Larrea                     $8.8  -73.0M  -0.8%  771.7M    126
130 Sergey Galitskiy                        $8.8  -13.7M  -0.2% -238.8M    128
131 William Lei Ding                        $8.7  175.9M   2.1%   -2.0B    132
132 Zong Qinghou                            $8.6   -3.9M   0.0% -793.6M    131
133 Dr Hui Ka Yan                           $8.5  156.6M   1.9%   -1.1B    136
134 German Khan                             $8.5   26.8M   0.3%  301.3M    133
135 Tan Siok Tjien                          $8.5   73.1M   0.9%    1.7B    135
136 Charles C Butt                          $8.5   46.7M   0.6% -757.1M    134
137 Mohamed Bin Issa Al Jaber               $8.3    2.1M   0.0%  -16.6M    137
138 Harold G Hamm                           $8.3   36.9M   0.4%    1.3B    139
139 Dr Cyrus S Poonawalla                   $8.2   -2.6M   0.0%   -1.9B    138
140 Takemitsu Takizaki                      $8.2  204.7M   2.6% -465.1M    144
141 Kwok Ping Sheung "Walter"               $8.1  109.3M   1.4% -100.6M    142
142 Dr John C Malone                        $8.1    6.0M   0.1% -421.5M    140
143 Prof Dr Reinhold Wuerth                 $8.1   -1.0M   0.0% -274.0M    141
144 Leslie Herbert Wexner                   $8.0   21.4M   0.3% -299.7M    143
145 Theo Albrecht Jr                        $8.0  225.6M   2.9%  792.6M    153
146 Richard Qiangdong Liu                   $8.0    8.1M   0.1%   -1.2B    145
147 R Budi Hartono                          $7.9   46.9M   0.6%  774.8M    147
148 Lau Luen Hung "Joseph"                  $7.9  136.5M   1.8%   -1.1B    152
149 Carl Cook                               $7.9   60.5M   0.8% -144.3M    149
150 Johann Graf                             $7.8     n/a    n/a   25.0M    148
151 Vagit Alekperov                         $7.8  -79.1M  -1.0%    1.1B    146
152 Daniel Andrew Beal "Andy"               $7.8  -21.5M  -0.3%   -1.0B    150
153 Gianluigi Aponte                        $7.7   36.9M   0.5%   -1.4B    154
154 Eyal M Ofer                             $7.6 -114.2M  -1.5% -417.0M    151
155 Michael Otto                            $7.6   37.6M   0.5%  157.8M    158
156 Michael Hartono                         $7.6   46.9M   0.6%  735.8M    159
157 Blair Kennedy Parry-Okeden              $7.6   -8.3M  -0.1%  -77.6M    155
158 James Cox Kennedy "Jim"                 $7.6   -8.3M  -0.1%  -77.6M    155
159 Dr Thomas F Frist Jr                    $7.6  -12.4M  -0.2%  611.5M    157
160 Woo Kwong-Ching "Peter"                 $7.5   77.1M   1.0%  107.1M    161
161 Dr Chanchai Ruayrungruang "Yan Bin"     $7.5  -32.1M  -0.4% -905.5M    160
162 He Xiangjian                            $7.4  102.4M   1.4%   -1.0B    165
163 Eli Broad                               $7.4    0.1M   0.0%  -29.6M    162
164 August Von Finck                        $7.3   -1.1M   0.0%  112.1M    163
165 Dr Lui Che-Woo                          $7.3  -32.0M  -0.4%  354.0M    164
166 Suh Kyung-Bae                           $7.3  133.9M   1.9% -640.3M    166
167 Gennady Timchenko                       $7.1   35.8M   0.5%  558.9M    168
168 Lei Jun                                 $7.1   42.4M   0.6%   -2.9B    170
169 Abigail P Johnson "Abby"                $7.1  -10.6M  -0.1% -919.2M    167
170 Pierre M Omidyar                        $7.1   17.7M   0.2% -232.9M    169
171 Charles Gerald John Cadogan             $7.1     n/a    n/a -360.0M    171
172 Ludwig Merckle                          $7.1  101.9M   1.5% -333.2M    175
173 Sean N Parker                           $7.0   38.9M   0.6%  340.6M    173
174 Richard S Lefrak                        $7.0   -1.4M   0.0%   -7.4M    172
175 Silvio Berlusconi                       $7.0   11.8M   0.2%   83.7M    174
176 Dr Christoffel H Wiese                  $6.8 -115.7M  -1.7%  479.1M    176
177 Zhang Zhidong                           $6.8  217.3M   3.3%    1.1M    188
178 Paolo Mario Rocca                       $6.8  -54.0M  -0.8% -307.4M    177
179 Bruce T Halle                           $6.8   -2.6M   0.0%  228.1M    179
180 Giorgio Armani                          $6.8   78.8M   1.2% -193.0M    183
181 Jean-Claude Decaux                      $6.7   27.8M   0.4%  593.7M    180
182 David Geffen                            $6.7    8.1M   0.1%  -74.4M    181
183 Graeme Richard Hart                     $6.7     n/a    n/a     n/a    182
184 Sandra Ortega Mera                      $6.7   17.5M   0.3% -179.2M    184
185 Jack Crawford Taylor                    $6.7 -126.5M  -1.9%   -2.7B    178
186 Richard D Kinder "Rich"                 $6.7   38.0M   0.6%    1.1B    186
187 Sherry Brydson                          $6.6   17.6M   0.3%  285.8M    185
188 Mark V Shoen                            $6.6   43.2M   0.7%  234.1M    187
189 Andrey Melnichenko                      $6.6  109.6M   1.7%  522.7M    189
190 Eva Gonda Rivera                        $6.5  -25.3M  -0.4% -132.3M    192
191 Simon Reuben                            $6.5  -52.8M  -0.8%  760.8M    190
192 David Reuben                            $6.5  -52.8M  -0.8%  760.8M    190
193 Richard B Cohen "Rick"                  $6.4  -21.4M  -0.3%  289.2M    193
194 Harry Triguboff                         $6.4     n/a    n/a     n/a    194
195 Hansjoerg Wyss                          $6.4  -32.8M  -0.5% -145.0M    195
196 Alexey Kuzmichev                        $6.3   27.4M   0.4%  232.2M    198
197 Lee Jae-Yong "Jay Y Lee"                $6.3  -34.0M  -0.5% -270.8M    197
198 Uday Suresh Kotak                       $6.3  -48.9M  -0.8% -855.7M    196
199 Dr Gordon Earle Moore                   $6.3  -10.1M  -0.2% -471.9M    200
200 Joern Rausing                           $6.3  -34.6M  -0.6%  602.3M    199
201 Nicholas Frank Oppenheimer "Nicky"      $6.2   60.1M   1.0%  110.7M    203
202 Arthur L Irving                         $6.2  -35.0M  -0.6% -126.9M    201
203 Lu Guanqiu                              $6.2  197.5M   3.3%   -2.1B    211
204 Enos Stanley Kroenke                    $6.2   -4.6M  -0.1%   11.6M    202
205 Melker Schoerling                       $6.1  144.6M   2.4% -409.8M    216
206 Zhou Qunfei                             $6.1  246.2M   4.2%   -1.6B    221
207 Travis C Kalanick                       $6.1     n/a    n/a    1.1B    205
208 Garrett Camp                            $6.1     n/a    n/a    1.1B    205
209 Dr Johann P Rupert                      $6.1  -29.2M  -0.5% -185.9M    204
210 Kirsten Rausing                         $6.0  -36.0M  -0.6%  653.5M    207
211 Finn Rausing                            $6.0  -36.0M  -0.6%  653.5M    207
212 Nathan Kirsh "Natie"                    $6.0   19.7M   0.3% -274.1M    215
213 Charles R Schwab "Chuck"                $6.0  -34.0M  -0.6% -735.4M    209
214 Stephen M Ross                          $6.0     n/a    n/a     n/a    214
215 Eka Tjipta Widjaja                      $6.0  -18.1M  -0.3%    1.0B    212
216 Majid Al Futtaim                        $6.0  -16.3M  -0.3% -337.9M    213
217 Eduardo Luiz Saverin                    $6.0   31.4M   0.5%  274.7M    217
218 Dr Lucio C Tan                          $6.0  -55.0M  -0.9%  276.7M    210
219 Dr Aloys Wobben                         $6.0  126.8M   2.2% -736.0M    223
220 Xu Shihui                               $6.0   59.5M   1.0% -532.2M    218
221 Christy R Walton                        $5.9   42.5M   0.7%  511.5M    220
222 Dr Desh Bandhu Gupta                    $5.9   20.5M   0.3%   16.1M    219
223 Micky Jagtiani                          $5.9    4.1M   0.1%   85.2M    222
224 Karl-Heinz Kipp                         $5.8   25.0M   0.4% -263.4M    225
225 Prof Dr Frederik Paulsen                $5.8   35.7M   0.6% -655.1M    226
226 Andreas Von Bechtolsheim                $5.8  -43.5M  -0.7% -446.8M    224
227 Dietmar Hopp                            $5.8   56.2M   1.0%  -26.1M    229
228 Diane M Hendricks                       $5.7  -30.8M  -0.5%  463.9M    227
229 Heinrich Deichmann                      $5.7  128.3M   2.3% -147.8M    234
230 T Ananda Krishnan                       $5.7  -41.9M  -0.7%  -63.3M    228
231 Antonia Axson Johnson                   $5.7   29.0M   0.5%  106.4M    230
232 Hiroshi Mikitani                        $5.7  134.6M   2.4% -987.0M    239
233 James Allen Pattison "Jim"              $5.7  -29.1M  -0.5%   94.0M    231
234 Dr Wee Cho Yaw                          $5.7   27.2M   0.5%  -57.7M    232
235 Hon Sir Michael David Kadoorie          $5.6   42.1M   0.8%   44.8M    236
236 Kenneth Cordele Griffin                 $5.6   31.9M   0.6% -520.0M    235
237 Shari Arison                            $5.6   -1.0M   0.0% -247.0M    233
238 Margarita Louis-Dreyfus                 $5.6   13.9M   0.2%    1.1B    238
239 David Arthur Duffield                   $5.6   97.6M   1.8% -509.1M    246
240 Bidzina Ivanishvili                     $5.6   25.0M   0.5%  -50.0M    240
241 Tan Sri Dato Lee Shin Cheng             $5.6   -9.9M  -0.2%  534.2M    237
242 Gwendolyn Sontheim Meyer                $5.6   30.3M   0.5%    1.7B    241
243 Pauline Macmillan Keinath               $5.6   30.3M   0.5%    1.7B    241
244 Whitney Macmillan                       $5.6   30.3M   0.5%    1.7B    241
245 Tsai Eng-Meng                           $5.5   25.3M   0.5%  -51.8M    247
246 Ray Lee Hunt                            $5.5  -11.0M  -0.2% -225.1M    244
247 Goh Cheng Liang                         $5.5  131.2M   2.5% -805.5M    255
248 George W Lucas Jr                       $5.5   44.2M   0.8% -232.9M    248
249 Tan Sri Dato Dr Teh Hong Piow           $5.4  -67.7M  -1.2%  222.9M    245
250 Liu Yonghao                             $5.4   -5.8M  -0.1%  -32.4M    249
251 Oleg Deripaska                          $5.4   89.8M   1.7% -446.6M    258
252 Curt G Engelhorn                        $5.4     n/a    n/a -125.0M    252
253 Kumar Mangalam Birla                    $5.4    9.6M   0.2% -284.7M    253
254 Richard Charles Branson                 $5.4   -9.8M  -0.2%  -75.9M    251
255 Emmanuel Besnier                        $5.4  -25.6M  -0.5% -132.6M    250
256 James K Irving "Jk"                     $5.4    0.3M   0.0%  529.0M    254
257 Ralph Lauren                            $5.3    8.5M   0.2%    4.8M    257
258 John Albert Sobrato                     $5.3     n/a    n/a  -25.0M    256
259 Lorenzo Servitje Sendra                 $5.3   62.7M   1.2%  378.5M    259
260 Yang Huiyan                             $5.2  233.6M   4.7%  524.7M    278
261 Shahid R Khan                           $5.2    6.1M   0.1%  780.6M    263
262 Lin Yu-Lin                              $5.2    0.4M   0.0% -101.5M    261
263 Chen Wai Wai "Vivien"                   $5.2   96.3M   1.9%   74.6M    271
264 Gustaf Douglas                          $5.2  -66.9M  -1.3%   20.7M    260
265 Tamara Hughes Gustavson "Tammy"         $5.2   57.9M   1.1%  184.7M    269
266 Stef Wertheimer                         $5.2   25.0M   0.5%     n/a    268
267 Frank P Lowy                            $5.1  -45.6M  -0.9%  194.8M    262
268 Joao Roberto Marinho                    $5.1  -23.6M  -0.5%  688.5M    264
269 Roberto Irineu Marinho                  $5.1  -23.6M  -0.5%  688.5M    264
270 Maria-Elisabeth Schaeffler-Thumann      $5.1   52.6M   1.0% -604.3M    270
271 Jose Roberto Marinho                    $5.1  -23.4M  -0.5%  683.2M    267
272 Bertil Hult                             $5.1  -69.1M  -1.3%   69.1M    266
273 Margaretta J Taylor                     $5.0   -5.5M  -0.1%   68.4M    274
274 James Cox Chambers                      $5.0   -5.5M  -0.1%   68.4M    274
275 Katharine J Rayner                      $5.0   -5.5M  -0.1%   68.4M    274
276 Abdullah Bin Ahmed Al Ghurair           $5.0  -32.3M  -0.6% -321.2M    273
277 Edward Crosby Johnson III "Ned"         $5.0    5.3M   0.1% -618.3M    277
278 Ricardo Benjamin Salinas Pliego         $5.0  -46.6M  -0.9% -672.4M    272
279 Petr Aven                               $5.0   27.8M   0.6%  116.7M    282
280 Trevor D Rees-Jones                     $5.0   -9.0M  -0.2%   21.0M    279
281 Steven Allan Spielberg                  $5.0   -0.4M   0.0%  -44.8M    284
282 Theo Mueller                            $5.0  -15.0M  -0.3%  -73.3M    280
283 Leonard Norman Stern                    $5.0  -25.0M  -0.5%   25.0M    281
284 John P Grayken                          $4.9  -28.8M  -0.6%  -53.7M    283
285 Dennis R Washington                     $4.9   57.5M   1.2%  167.2M    288
286 Robert E Rich Jr "Bob"                  $4.9   -9.1M  -0.2%  -14.6M    285
287 Joseph C Lewis "Joe"                    $4.9    2.5M   0.1% -278.8M    289
288 Jeffery D Hildebrand "Jeff"             $4.9  -63.7M  -1.3% -376.0M    287
289 Lim Kok Thay                            $4.9  -76.4M  -1.5%  703.9M    286
290 Prof David Cheriton                     $4.8  -22.5M  -0.5% -337.6M    290
291 Richard Devos Sr                        $4.8   95.7M   2.0%  293.3M    296
292 Brian Acton                             $4.8   21.5M   0.4%  187.6M    294
293 Theodore N Lerner "Ted"                 $4.8     n/a    n/a     n/a    293
294 Joseph C Tsai                           $4.8  -40.9M  -0.9% -539.6M    292
295 Sumner M Redstone                       $4.8   32.0M   0.7%  199.5M    297
296 Vincent Bollore                         $4.8  129.4M   2.8% -739.4M    312
297 Erivan Karl Haub                        $4.8  -69.2M  -1.4%  -83.6M    291
298 Stan F Druckenmiller                    $4.7     n/a    n/a     n/a    295
299 Gautam S Adani                          $4.7   15.2M   0.3% -752.0M    298
300 John P Sall                             $4.7   29.6M   0.6% -387.4M    301
301 James S Davis "Jim"                     $4.7   31.4M   0.7% -196.3M    302
302 Terrence M Pegula "Terry"               $4.7     n/a    n/a     n/a    300
303 Sir Philip Green                        $4.7   52.7M   1.1% -591.0M    306
304 Laurence Graff                          $4.7   65.3M   1.4%   15.4M    309
305 Wang Chuan-Fu                           $4.7  159.8M   3.5% -871.6M    317
306 Guenther Fielmann                       $4.7   28.9M   0.6%  -34.2M    305
307 Elisabeth Mohn "Liz"                    $4.7    1.3M   0.0%   65.3M    304
308 Charles Francis Dolan                   $4.7   -6.9M  -0.1%  -60.4M    303
309 Chung Mong-Koo                          $4.7  -55.0M  -1.2%   49.3M    299
310 Kenneth B Dart                          $4.7   22.2M   0.5% -236.0M    310
311 Lynn Schusterman                        $4.7   -2.3M   0.0%  -60.3M    308
312 Dr Emanuele Saputo "Lino"               $4.6  -29.5M  -0.6%  794.2M    307
313 George R Roberts                        $4.6   -1.9M   0.0% -273.1M    311
314 J Christopher Reyes "Chris"             $4.6   58.7M   1.3%   51.4M    315
315 M Jude Reyes                            $4.6   58.7M   1.3%   51.4M    315
316 Guenter Herz                            $4.6   -2.1M   0.0%   73.4M    314
317 Li Tzar Kai "Richard"                   $4.6  -14.5M  -0.3%   -7.4M    313
318 Zhang Shiping                           $4.6   87.4M   2.0%  207.0M    322
319 Daniela Herz                            $4.6   -2.1M   0.0%   48.4M    318
320 James Dyson                             $4.5   83.8M   1.9%   -1.2B    325
321 Gong Hongjia                            $4.5   88.6M   2.0% -678.9M    333
322 Troels Holch Povlsen                    $4.5   44.5M   1.0% -652.6M    328
323 Pierre Bellon                           $4.5    4.2M   0.1%  449.3M    324
324 Mary Alice Dorrance Malone              $4.5  -18.6M  -0.4%  613.2M    320
325 Maria Helena Moraes Scripilliti         $4.5  -41.0M  -0.9%  346.7M    319
326 Charles Bartlett Johnson                $4.4  -14.0M  -0.3% -118.0M    323
327 Samuel Zell "Sam"                       $4.4   -9.0M  -0.2% -109.9M    326
328 Vikram Lal                              $4.4  -49.7M  -1.1%  609.8M    321
329 Leon David Black                        $4.4    2.3M   0.1%  171.5M    332
330 Rupert Harris Johnson Jr                $4.4  -14.3M  -0.3%  126.9M    330
331 Axel Oberwelland                        $4.4   -2.0M   0.0%  -74.7M    334
332 Ermirio Pereira De Moraes               $4.4  -40.1M  -0.9%  335.6M    329
333 Walter Faria                            $4.4  -42.7M  -1.0%  288.0M    331
334 Wolfgang Herz                           $4.4   14.4M   0.3%  -65.8M    335
335 Michael Herz                            $4.4   14.4M   0.3%  -65.8M    335
336 Wei Jianjun                             $4.4  127.2M   3.0%   -1.7B    341
337 Dieter Schnabel                         $4.4  -79.2M  -1.8%  -92.7M    327
338 Hui Wing Mau                            $4.4  135.5M   3.2% -477.1M    343
339 Ralph Dommermuth                        $4.3   51.5M   1.2% -402.0M    340
340 Jeffrey S Skoll "Jeff"                  $4.3    4.8M   0.1%   20.8M    337
341 Dr Bernard C Sherman "Barry"            $4.3  -11.5M  -0.3%   -1.1B    338
342 Ng Chee Tat "Philip"                    $4.3    5.1M   0.1% -142.1M    339
343 Guo Guangchang                          $4.3   81.3M   1.9% -681.1M    355
344 Pedro Moreira Salles                    $4.2   -3.9M  -0.1%  548.8M    344
345 Dannine Duncan Avara                    $4.2  -12.5M  -0.3% -111.0M    342
346 Walther Moreira Salles Jr               $4.2    0.5M   0.0%  548.3M    345
347 Fernando Roberto Moreira Salles         $4.2    0.0M   0.0%  547.8M    345
348 Masatoshi Ito                           $4.2  113.2M   2.8% -236.0M    361
349 John A Catsimatidis                     $4.2    1.1B  33.8%  980.2M    489
350 Tan Kim Choo                            $4.2    9.1M   0.2%  -42.9M    353
351 Magdalena Martullo-Blocher              $4.2  -17.1M  -0.4%  329.0M    348
352 Milane Duncan Frantz                    $4.2  -12.5M  -0.3% -136.0M    349
353 Scott Daniel Duncan                     $4.2  -12.5M  -0.3% -136.0M    349
354 Joao Moreira Salles                     $4.2  -24.5M  -0.6%  523.3M    345
355 Edward S Lampert                        $4.2  -15.1M  -0.4%  -87.6M    351
356 Ng Chee Siong "Robert"                  $4.2    4.9M   0.1% -142.9M    354
357 Robert B Rowling                        $4.2   91.3M   2.2%  125.2M    362
358 Randa Duncan Williams                   $4.2  -13.1M  -0.3% -150.8M    352
359 David K R Thomson                       $4.2   11.8M   0.3%   44.6M    356
360 Nassef Onsi Naguib Sawiris              $4.2   39.8M   1.0% -624.9M    358
361 Andrey Guryev                           $4.1  -19.5M  -0.5%  245.3M    357
362 Wang Wenyin                             $4.1   -3.4M  -0.1% -307.3M    359
363 Andre Serenus Hoffmann                  $4.1   11.9M   0.3% -276.3M    364
364 Thomas Joseph Morris "Tom"              $4.1   -2.2M  -0.1% -296.5M    363
365 Juan Roig Alfonso                       $4.1  168.5M   4.3%  148.2M    382
366 Alexander Otto                          $4.1   29.3M   0.7%   -1.6M    367
367 Rahel Blocher                           $4.1  -42.1M  -1.0%  304.0M    360
368 James Douglas Packer                    $4.1    4.7M   0.1%    4.2M    366
369 Henry Roberts Kravis                    $4.1   -1.8M   0.0% -152.6M    365
370 Enrique Ramon Coppel Luken              $4.0  275.6M   7.3%   88.3M    404
371 George Siao Kian Ty                     $4.0   -4.4M  -0.1%  239.2M    368
372 Wang Wei                                $4.0   48.1M   1.2%  -44.9M    372
373 Denis O’Brien Jr                        $4.0  -16.0M  -0.4%  265.0M    369
374 John Paul Dejoria                       $4.0    7.6M   0.2%  -68.6M    370
375 Isak Andic Ermay                        $4.0   10.8M   0.3% -149.0M    371
376 Pankaj R Patel                          $4.0   33.0M   0.8%  186.8M    376
377 Vera Michalski-Hoffmann                 $4.0   30.8M   0.8% -219.6M    378
378 Maja Hoffmann                           $4.0   30.8M   0.8% -219.6M    378
379 Dr Hans-Peter Wild                      $4.0   24.2M   0.6%  107.5M    377
380 Quek Leng Chan                          $4.0   -9.3M  -0.2%   24.0M    374
381 Bruno L Schroder                        $4.0  -10.5M  -0.3% -408.3M    373
382 Benu Gopal Bangur                       $4.0   85.3M   2.2%  -13.6M    387
383 Ursula Engelhorn                        $4.0     n/a    n/a  -75.0M    380
384 Walter Scott Jr                         $3.9    0.0M   0.0%  187.5M    381
385 Prince Sultan Bin Mohammed  Al Kabeer   $3.9  -60.5M  -1.5% -430.6M    375
386 Peter J Thomson                         $3.9   12.5M   0.3% -104.7M    384
387 Taylor Lynne Thomson                    $3.9   12.1M   0.3%   44.9M    383
388 Siegfried Meister                       $3.9   11.4M   0.3%  636.7M    385
389 Victor Rashnikov                        $3.9  106.0M   2.8%  715.6M    398
390 Ma Jianrong                             $3.9   16.4M   0.4% -412.1M    386
391 Thomas M Schmidheiny                    $3.9   59.2M   1.5% -610.3M    392
392 Frits J D Goldschmeding                 $3.9   14.9M   0.4% -504.7M    388
393 Stephen Bechtel Jr                      $3.9   25.0M   0.7%    3.3M    391
394 Randal J Kirk                           $3.8  -15.2M  -0.4%  201.8M    389
395 Peter Andreas Thiel                     $3.8    0.7M   0.0%    5.5M    393
396 David M Green                           $3.8  -15.0M  -0.4%  109.7M    390
397 Dr Fredrik Lundberg                     $3.8   22.2M   0.6% -224.0M    402
398 Issad Rebrab                            $3.8  -11.4M  -0.3% -375.6M    394
399 Traudl Engelhorn-Vechiatto              $3.8     n/a    n/a  -75.0M    397
400 Odd Reitan                              $3.8 

Wednesday, March 9, 2016

This 4,000-year old financial indicator says that a major crisis is looming

Over 4,000 years ago during Sargon the Great’s reign of the Akkadian Empire, it took 8 units of silver to buy one unit of gold.
This was a time long before coins. It would be thousands of years before the Lydians in modern day Turkey would invent gold coins as a form of money.
Back in the Akkadian Empire, gold and silver were still used as a medium of exchange.
But the prices of goods and services were based on the weight of metal, and typically denominated in a unit called a ‘shekel’, about 8.33 grams.
For example, you could have bought 100 quarts of grain in ancient Mesopotamia for about 2 shekels of silver, a weight close to half an ounce in our modern units.
Both gold and silver were used in trade. And at the time the ‘exchange rate’ between the two metals was fixed at 8:1.
Throughout ancient times, the gold/silver ratio kept pretty close to that figure.
During the time of Hamurabbi in ancient Babylon, the ratio was roughly 6:1.
In ancient Egypt, it varied wildly, from 13:1 all the way to 2:1.
In Rome, around 12:1 (though Roman emperors routinely manipulated the ratio to suit their needs).
In the United States, the ratio between silver and gold was fixed at 15:1 in 1792. And throughout the 20th century it averaged about 50:1.
But given that gold is still traditionally seen as a safe haven, the ratio tends to rise dramatically in times of crisis, panic, and economic slowdown.
Just prior to World War II as Hitler rolled into Poland, the gold/silver ratio hit 98:1.
In January 1991 as the first Gulf War kicked off, the ratio once again reached 100:1, twice its normal level.
In nearly every single major recession and panic of the last century, there was a sharp rise in the gold/silver ratio.
The crash of 1987. The Dot-Com bust in the late 1990s. The 2008 financial crisis.
These panics invariably led to a gold/silver ratio in the 70s or higher.
In 2008, in fact, the gold/silver ratio surged from below 50 to a high of roughly 84 in just two months.
We’re seeing another major increase once again. Right now as I write this, the gold/silver ratio is 81.7, nearly as high as the peak of the 2008 financial crisis.
This isn’t normal.
In modern history, the gold/silver ratio has only been this high three other times, all periods of extreme turmoil—the 2008 crisis, Gulf War, and World War II.
This suggests that something is seriously wrong. Or at least that people perceive something is seriously wrong.
There are so many macroeconomic and financial indicators suggesting that a recession is looming, if not an all-out crisis.
In the US, manufacturing data show that the country is already in recession (more on this soon).
Default rates are rising; corporate defaults in the US are actually higher now than when Lehman Brothers went bankrupt back in 2008.
These defaults have put a ton of pressure on banks, whose stock prices are tanking worldwide as they scramble to reinforce their balance sheets against losses.
I just had a meeting with a commercial banker here in Sydney who told me that Australian regulators are forcing the bank to increase its already plentiful capital reserves by over 40% within the next several months.
This is an astonishing (and almost impossible) order.
The regulators wouldn’t be doing that if they weren’t getting ready for a major storm. So even the financial establishment is planning for the worst.
Good times never last forever, especially with governments and central banks engineering artificial prosperity by going into debt and printing money.
These tactics destroy a financial system. And the cracks are visibly expanding.
So while the gold/silver ratio isn’t any kind of smoking gun, it is an obvious symptom alongside many, many others.
Now, the ratio may certainly go even higher in the event of a major banking or financial crisis. We may see it touch 100 again.
But it is reasonable to expect that someday the gold/silver ratio will eventually fall to more ‘normal’ levels.
In other words, today you can trade 1 ounce of gold for 80 ounces of silver.
But perhaps, say, over the next two years the gold/silver ratio returns to a more historic norm of 55. (Remember, it was as low as 30 in 2011)
This means that in the future you’ll be able to trade the 80 ounces of silver you acquired today for 1.45 ounces of gold.
The final result is that, in gold terms, you earn a 45% “profit”. Essentially you end up with 45% more gold than you started with today.
So bottom line, if you’re a speculator in precious metals, now may be a good time to consider trading in some gold for silver

Tuesday, March 8, 2016

罗杰斯:美国1年内铁定落入衰退 已出清日元仓位

商品大王罗杰斯(Jim Rogers)较少见地给出了“末日预言”,他日前斩钉截铁地表示,美国经济在未来12个月内将会陷入衰退。


罗杰斯在接受美国当地主流媒体采访时表示,美国经济一年之内陷入低迷的概率是100%。
罗杰斯是享誉全球的投资大师,曾与索罗斯共同创办量子基金。
他说:“美国上一次经济衰退距今已经7、8年,通常从历史上看,总是会出现某些原因,让我们每隔4-7年就会遇到衰退,并不一定总是每隔4到7年就会出现,但是看看债券市场,各品种已是步履蹒跚。”
对于什么可能会触发无序去杠杆的进程以及经济衰退,罗杰斯并没有具体说明。但他表示,中国、日本和欧元区的经济低迷意味着可能会有许多的蔓延渠道。
他指出,如果投资者专注于正确的数据,那么已经有迹象表明,美国经济摇摇欲坠。但他强调,“要关注那些真正的数据,而不是政府给出的数据。”
鉴于他所预计的各种经济险象,罗杰斯在做多美元。罗杰斯表示,“美元可能会转变为泡沫。如果全球各地市场崩溃,假设这种情况发生,每个人都会把自己的钱兑换成美元,美元就有可能产生泡沫。”
他还补充说,从历史上看,美元升值不利于大宗商品。
罗杰斯的上述表态也符合他本周稍早的一次采访内容,他当时称自己正在做空美股,同时做多中国。
他这样解释:“中国市场比起历史高位已经回落了60%,而美国市场仍然接近它的历史高位。”
这位大鳄也反复对美国的经济前景表示疑虑,他当时说:“情况正在恶化,我敢肯定,最新的GDP数据是虚假的,只有政府才宣称经济繁荣,其他所有人都知道事实并非如此。”
罗杰斯同时指出,虽然日元通常被看作避险货币,但是由于日本央行资产负债表的大规模持续扩张,在投资者纷纷避险的时候,日元不会获益。他称已在上周五出清了其持有的日元头寸。
对于增持中国方面,他则一如既往地看好。罗杰斯也在美国时间1月12日表示,中国经济增速确实放缓,但属于正常现象,不应该把世界环境不景气归咎在中国身上。

Friday, March 4, 2016

Gold-Silver Ratio Breakout Report, 28 Feb, 2016

The gold to silver ratio moved up very sharply this week, +4.2%. How did this happen? It was not because of a move in the price of gold, which barely budged this week. It was due entirely to silver being repriced 66 cents lower.
This ratio is now 83.2. It takes 83.2 ounces of silver to buy an ounce of gold. Conversely, it takes 1/83.2oz (about 0.37 grams) of gold to buy an ounce of silver.
This ratio is now within a hair’s breadth of breaking out past the high set on Oct 17, 2008. See the historical graph (based on LBMA silver fix and PM gold fix data, provided by Quandl).
The Historical Ratio of the Gold Price to the Silver Price
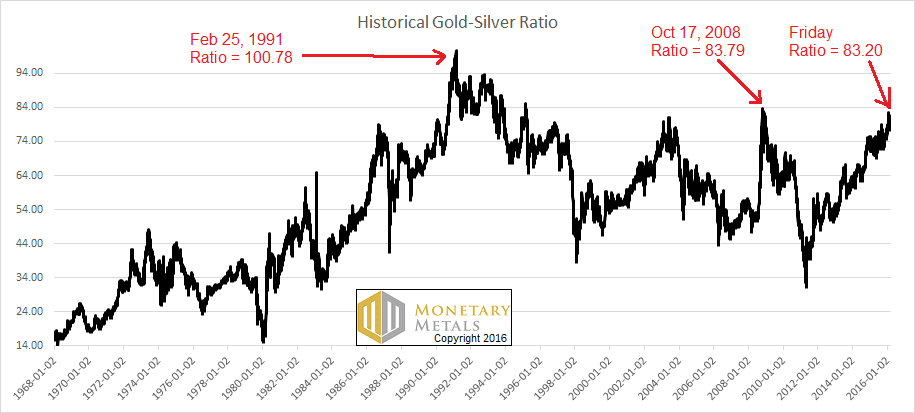
letter feb 28 historical ratio
Monetary Metals has been predicting a ratio well over 80 for a long time. And for two months, we have been calling for it to go much higher still. Could there be a correction? Absolutely. Could the fundamentals change? We expect they will—at some point. We will call that when we see it.
Speaking of the fundamentals, read on for the only true picture of the gold and silver supply and demand fundamentals…
But first, here’s the graph of the metals’ prices.
The Prices of Gold and Silver
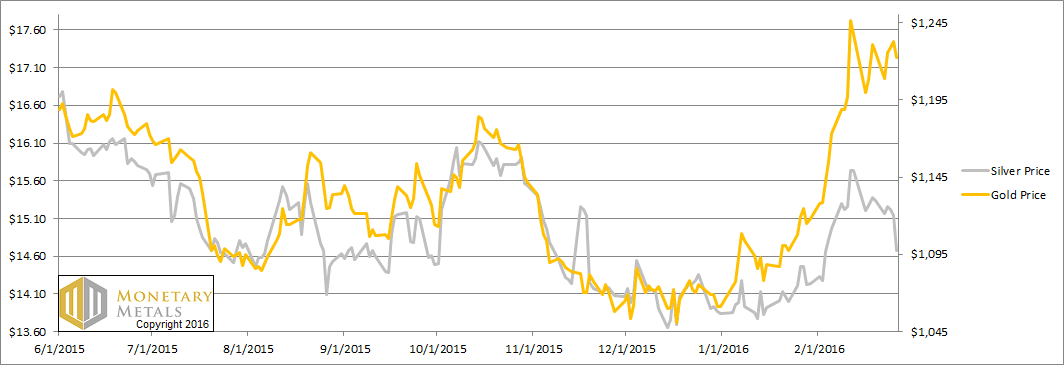
letter feb 28 prices
We are interested in the changing equilibrium created when some market participants are accumulating hoards and others are dishoarding. Of course, what makes it exciting is that speculators can (temporarily) exaggerate or fight against the trend. The speculators are often acting on rumors, technical analysis, or partial data about flows into or out of one corner of the market. That kind of information can’t tell them whether the globe, on net, is hoarding or dishoarding.
One could point out that gold does not, on net, go into or out of anything. Yes, that is true. But it can come out of hoards and into carry trades. That is what we study. The gold basis tells us about this dynamic.
Conventional techniques for analyzing supply and demand are inapplicable to gold and silver, because the monetary metals have such high inventories. In normal commodities, inventories divided by annual production (stocks to flows) can be measured in months. The world just does not keep much inventory in wheat or oil.
With gold and silver, stocks to flows is measured in decades. Every ounce of those massive stockpiles is potential supply. Everyone on the planet is potential demand. At the right price, and under the right conditions. Looking at incremental changes in mine output or electronic manufacturing is not helpful to predict the future prices of the metals. For an introduction and guide to our concepts and theory, click here.
Next, this is a graph of the gold price measured in silver, otherwise known as the gold to silver ratio. The ratio was up substantially.
The Ratio of the Gold Price to the Silver Price
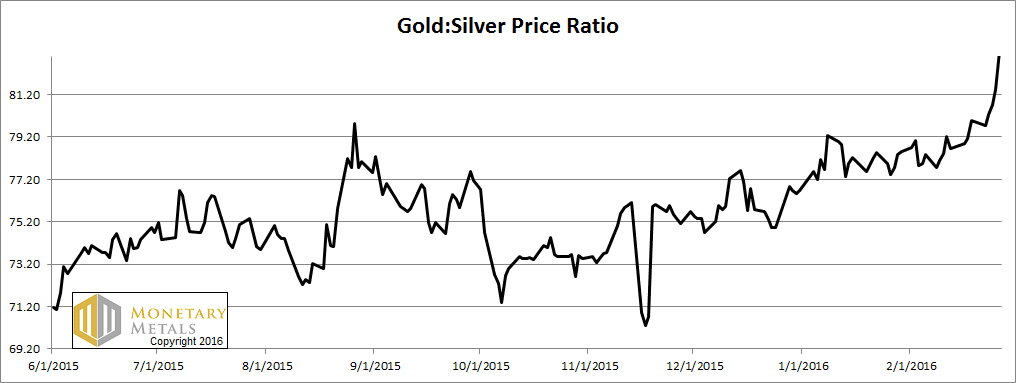
letter feb 28 ratio
For each metal, we will look at a graph of the basis and cobasis overlaid with the price of the dollar in terms of the respective metal. It will make it easier to provide brief commentary. The dollar will be represented in green, the basis in blue and cobasis in red.
Here is the gold graph.
The Gold Basis and Cobasis and the Dollar Price
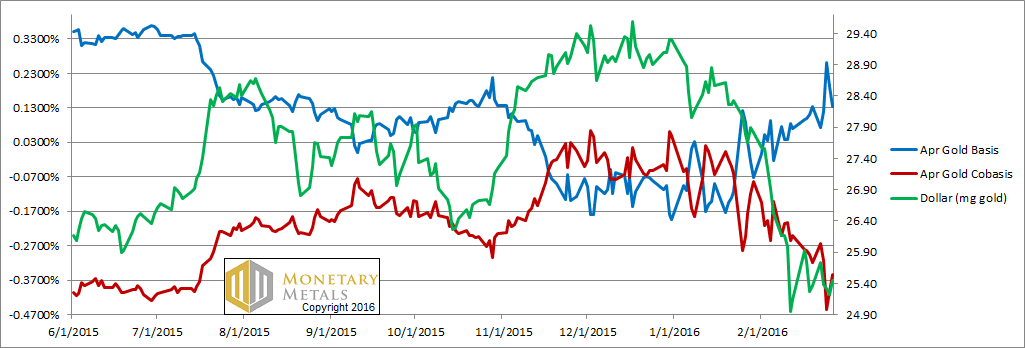
letter feb 28 gold
The price was basically unchanged. The cobasis (i.e. scarcity) was also just about unchanged. This, by the way, was also true for farther-out contracts although we only show April in this free Report.
We calculate a fundamental gold price of over $1,440. This is the price we would have if the price effect of speculation was subtracted out of the market. Who would be shorting gold at this point? We have an idea of one group that may appear sacrilegious to the gold community.
Let’s get it out of the way. No, it’s not the Powers That Be, the commercial banks, the central banks, or the Illuminati. It’s the silver bugs. Consider the widespread belief—at least outside of readers of this Report—in silver outperformance. Who doesn’t think the ratio should be far lower—50 for starters, on the way to 16 as in Ye Times of Olde?
How would you trade this thesis? You would short gold futures and go long silver futures in equal dollar amounts. This would of course push up the price of silver, and push down the price of gold
We would say to anyone in this trade to be careful, but obviously they don’t read this Report. If you must trade this trend, you should do the opposite: long gold, short silver (and be wary of violent corrections).
How do we explain that the price of gold is 15% below its fundamental, while the price of silver is only at a 2% premium? The silver market is less liquid than the gold market, so equal dollar values of this trade would push the silver price up more than it would push the gold price down.
We have two thoughts on this. One, if most traders think of the metals as commodities—we saw yet another article on this theme today—and if commodities are in a bear market, then the metals are hated. Perhaps silver would be 30% under its fundamental—i.e. about $10—if it weren’t for this trade that alters the relationship of silver to gold.
Maybe. Our other thought is that if this is a new bull market in gold—i.e. a bear market in the dollar—it’s in stealth mode at the moment. Mainstream traders are not excited about gold speculation. They’re not buying gold futures, and may even be short. We are aware of the Commitment of Traders report (COT), showing that non-commercials (i.e. speculators) have a net long position. It’s the commercials (i.e. miners and jewelers) who have the short position. Perhaps it’s the miners putting on more hedges—i.e. selling more of their production forward. Maybe it’s the reduced forward buying of the gold users.
Whatever the factors, one thing’s for sure. The price of gold in the futures market is sagging relative to the price of gold in the spot market.
Our approach is not based on aggregate quantities. That’s why we don’t stop at the COT data. We look at spreads. Spreads inform us in a way that strict quantity analysis cannot. If you doubt this, ask how many COT analysts predicted the price action in silver or the ratio.
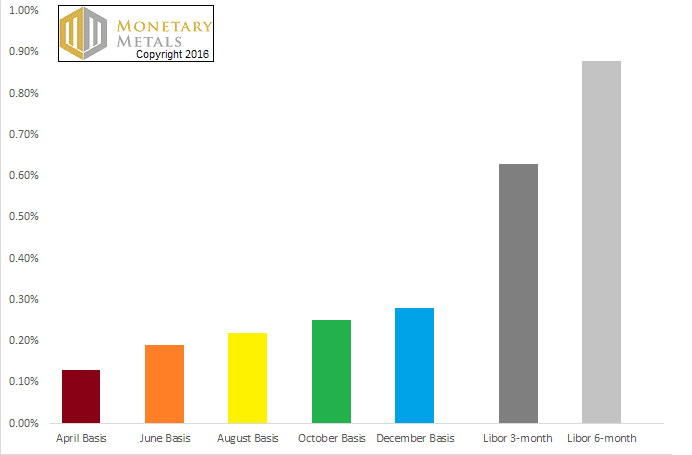
This graph shows the rates we observe to carry gold for contracts in 2016 (i.e. basis).
The Gold Bases for 2016 and LIBOR
letter feb 28 basis libor
These yields are hardly worth anyone’s while to buy gold and sell a future against it, not to mention that the cost of funding this trade is about twice the return on the trade. Carrying gold does not pay, because gold is not abundant enough in the market to be available to carry.
Now let’s look at silver.
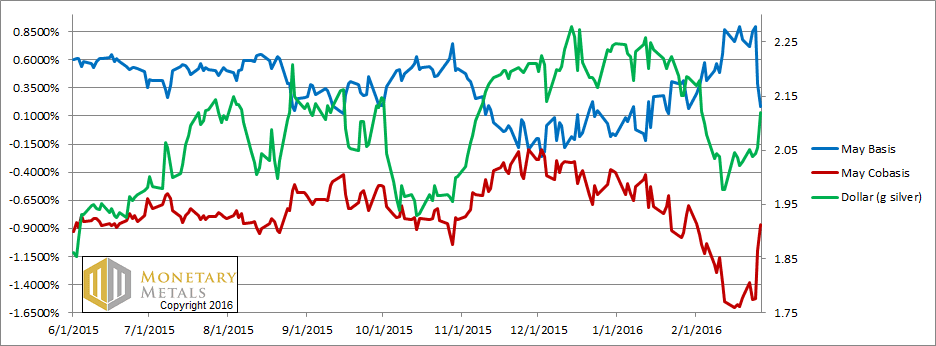
The Silver Basis and Cobasis and the Dollar Price
letter feb 28 silver
In May silver, we see the scarcity (i.e. cobasis) drops on Tuesday when the price of the dollar falls (i.e. the price of silver rises), and a rising scarcity as silver is becoming cheaper. It’s no surprise that the big rise in scarcity occurred on Friday, with the big drop in price. No question, futures sold off.
Another glance confirms it. Look at the epic drop in the basis. It’s down almost to match the gold basis (though the cobasis is nowhere near what is in gold). To review, here are our definitions:
Basis = Future(bid) – Spot(ask)
Cobasis = Spot(bid) – Future(ask)
The basis is down because the bid on the May contract is being pressed down. Silver—at this price—is no longer so abundant. The basis is well below LIBOR. However, it’s not particularly scarce. The ask on the May contract is still strong, still being lifted by buying pressure.
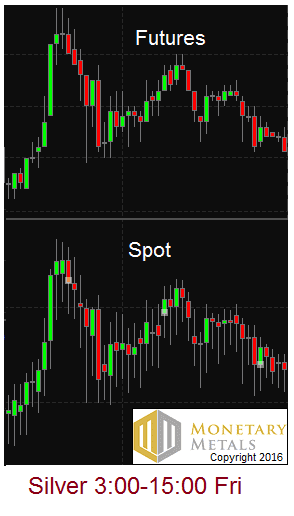
Last week, we showed a picture of “icicles” dripping on the chart of spot silver.
letter feb 21 silver icicles
This is in contrast to the futures chart. First, thanks to several folks who wrote to say that these are usually called “shadows”. We used the term icicle because of its connotation of dripping down. We believe that the cause is that metal is being sold, pushing the price down. But then that creates an actionable arbitrage to carry silver. So the market makers buy spot and sell the future. This does two things. One, obviously, it records a trade in the spot market at ask price and lifts the ask. Two, it presses the bid price in the futures market.
If this is correct, then silver is intermittently abundant. At times when there’s selling of metal in the spot market, it’s abundant enough to go into the warehouse. At other times, and we’ll see more of this if the price falls further, it’s not so abundant.
The fundamental price of silver fell about a nickel this week. The market price is much closer to the fundamental now.
This brings us to the ratio. The fundamental on the ratio hit over 100 this week.
What does it mean that the market ratio is just about to break out past its 2008 high, while the fundamental is predicting we could hit the record set in 1991? Ironically, the gold-silver ratio is showing something that most mainstream signals cannot.
The seasonally adjusted unemployment number looks brilliant at under 5%. The S&P 500 index of stocks is only about 10% off its highs from the first half of last year. Sure, there’s that epic collapse in the price of crude oil and other commodities, but pay no heed. Cheap oil means cheap gas which gives money back to consumer who can spend spend spend our way to prosperity.
The gold to silver ratio is showing us that the junior money is getting cheaper relative to the senior money. It is showing us that the metal which has industrial demand as well as monetary is falling relative to the metal whose demand is entirely monetary. It is also showing us that tightening credit conditions are starting to matter. So far as silver is concerned, credit conditions today match those which existed in October 2008.

Thursday, March 3, 2016

2016年10家表现不错的公司,AIRASIA浴火凤凰??

Good sharing by Harry
http://harryteo.blogspot.my/
2016年已经度过了2个月,相信大家也拿到了自己的投资成绩单。现在的股市非常敏感,业绩出炉出色可以上涨一点,业绩出炉还不错的就可以会下跌,业绩差或者不如“市场预期”的就会暴跌(GESHEN, PETRONM, WELLCAL等).今年的马股还是挑战重重,市场的情绪暂时还是有点悲观的。

不过仔细一找,其实股市里还是有一些公司可以逆势而行。不过最重要还是公司业绩盈利要进步,股息要照派。今年消费以及建筑领域表现不俗,一些有基本面的出口股的业绩盈利也突破历史新高。马币走低以及原油价格走低的或许会反映在今年一些公司的业绩上,这就让我们拭目以待吧。

现在我们来看看这两个月表现不错的几家公司。


  • AIRASIA终于摆脱亏损的阴影,营业额突破新高来到21.6亿马币,Net  Profit 高达5.54亿。不过值得注意的是其中1.24亿马币是Defferred Taxation,而且部分的盈利是来字Maintenance Service Revenue,这是大家必须注意的。不过短期来说,AA还是会受到投资者的追捧的。所以今年AA的股价涨幅26.36%,AAX也有50%的涨幅。
  • SLP的盈利连年进步,股价去年上涨了222%,而今年短短两个月也上涨了23.68%。Plastic领域今年在原油价格低迷下应该会有不错的表现。
  • PADINI的盈利连续两个季度突破交出了让人惊喜的盈利,而且股息也很吸引人。所以股价也在今年突破了新高,不过未来要持续成长相信很具有挑战。
  • KIMLUN的盈利两年进步,而且还派发了5.8仙的股息,周息率高达3.6%。加上手上握有11亿的合约,今年前景看涨。
  • PAVREIT以及IGBREIT最近突破股价新高,原因可能是市场不明朗,所以所以投资者偏向高股息的产业信托。
  • SPRITZER的盈利连年进步,所以股价也跟着走高。而且它持有的YEELEE在代理Red Bull之后表现亮眼,所以今年消费股会很有看头。
  • 最后SCIENTX的股价今年上涨了13.44%, 主要原因是上个季度交出了新高的盈利,所以吸引了不少投资人的目光。只要未来几个季度盈利持续成长,SCIENTX相信会有不错的Return。
  • HAPSENG最新季度的盈利下跌,所以股价从高峰的7.93下跌到现在的7.58.以市值来计算,HAPSENG的市值接近170亿,已经是马来西亚前25的巨擎。不知道会不会被列入30大蓝筹股呢?

AirAsia shines, up 12.9% for the week

Since reporting their outstanding 4th quarter results announced last Friday, the share price of AirAsia has been on a strong rally, gaining 5.8% on Monday and a further 6.8% yesterday. Macquarie Equities Research (MER)’s released a report looking at AirAsia’s earnings, excerpts can be found below…

Event
  • AirAsia reported an adjusted profit of RM311mn for 4Q15, bringing FY15 adjusted profit to RM697mn (+70% YoY), which is 32% and 16% ahead of MER’s and consensus estimates. MER believes the following key highlights from the results will be received positively by the market: 1) ability to sustain passenger yields whilst delivering 10% passenger growth and improved load factors in 4Q15, 2) reduction in receivables from associates and 3) strong cashflow generation (OCF yield of 57%).

Impact
4Q15 highlights
  • Revenue grew 16%, mainly on the back of 10% passenger growth and flat passenger yields.
  • Interestingly, passenger yields excluding fuel surcharge increased 17% YoY.
  • Its Malaysian and Philippines entity reported earnings before interest, taxes, depreciation, amortization and rent (EBITDAR) growth while the Indonesian entity continues to disappoint with a reduction in EBITDAR. Its Thai entity reported a slight reduction in EBITDAR.
 
  • FY15 highlights
    • The beat to MER’s FY15 estimates was top line-driven. Revenue, which grew 8% YoY, was 7% and 6% ahead of MER’s and consensus estimates.
    • Unit cost dropped 4.1%, mainly driven by lower fuel expenses. Reduction in fuel cost, however, was offset by increases in maintenance, overhaul and user charges, a common theme among the three AirAsia entities that have reported their results.
 
  • Balance sheet & cashflow
    • Receivables from Indonesia AirAsia and Philippines AirAsia fell to RM618mn (end-FY14: RM1,411mn) and RM840mn (end-FY14: RM948mn), respectively. The reduction of Indonesia AirAsia's receivables was mainly driven by the conversion of receivables into a perpetual bond (IDR2,058bn =~RM610mn).
    • Cash balance increased to RM2.4bn (from RM1.3bn as end Dec 2014).
    • Net gearing fell slightly to 2.3x from 2.5x in Dec 2014.
 
  • The negative
Indonesia AirAsia and Philippines AirAsia remain loss-making in 4Q15 despite earlier projections by management that both will be profitable in 4Q15. Net adjusted losses for both entities were, however, narrowed.
 
 
  • Outlook
    • Group CEO mentioned that in Malaysia the company is benefiting from the weaker currency environment that has led to local consumers trading down for travel.
    • Also, the CEO commented that demand from Chinese travelers has remained resilient, and he expects the visa waiver initiative to boost arrivals in the coming quarters. MER highlighted that AirAsia is most poised to benefit from the rising number of Chinese tourists into the country given it has the largest market share on Malaysia-China routes.
    • Indonesia AirAsia will continue to rationalise its network with a reduction in fleet size "to minimise operational losses."
    • The company expects Philippines AirAsia to break even "in the coming months," aided by the retirement of two remaining inefficient aircraft and capacity rationalisation.
    • The launch of AirAsia Japan has been pushed back slightly from "early 2016" to "first half of 2016."‌

Action and recommendation
Reiterate Outperform.
Source: Macquarie Research - 2 Mar 2016

AirAsia PH reduces losses, expects to break even this year

The Philippine unit of Southeast Asia’s largest budget airline said net loss fell 46 percent to P3.09 billion in 2015 from P5.18 billion in 2014.
Air Asia Inc., operator of Air Asia Philippines, posted a net loss of P118.79 million in the October-to-December period from a loss of P1.28 billion year-on-year.
“We are proud to have turned around our operations [in the Philippines] in this quarter and achieved figures close to breakeven,” AirAsia Group chief executive Tony Fernandes said.
Fernandes said the company expects a similar trend this year, with a revenue improvement of 25 percent to 30 percent projected in the first quarter of 2016 from a year ago.
“In addition, our forecast shows high load factor in the current quarter, which coupled with low oil prices, is expected to allow us to continue achieving break even or even profitability in our Philippines’ operations in the coming months,” he said.
The company’s revenues amounted to P8.93 billion in 2015, up 18 percent from P7.54 billion in 2014.
The airline company attributed the 19 percent growth in revenue to the increase in the number of passengers carried, as capacity rose 3 percent  year-on-year.
Air Asia Philippines carried 3.59 million passengers in 2015 from 3.03 million last year, while load factor rose to 81 percent.
The airline has 14 operating aircraft serving domestic destinations, such as Kalibo (Boracay), Puerto Princesa (Palawan), Tagbilaran (Bohol), Cebu and Tacloban. It also flies to China, Korea, Macau and Hong Kong.
“We will be disciplined and continue with our planned retirement of two remaining inefficient aircraft in first quarter of 2016 as well as matching capacity growth with demand, while pushing forward with our plans to market the Philippines as an untapped tourist destination with great potential as part of the governments campaign to ‘Visit the Philippines Again 2016’,” Fernandes said.
Malaysia’s Air Asia, through AA International, owns 40 percent of Philippines’ Air Asia Inc., while Filipinos Marriane Hontiveros, Michael Romero, Antonio Cojuangco and Alfredo Yao own the balance of 60 percent.

http://thestandard.com.ph/business/200774/air-asia-ph-reduces-losses-expects-to-break-even-this-year.html

AirAsia to soar 100%-200%. Phoenix RISING

know that airline stocks are the perfect anti-oil instrument in this current cycle?
Oil and fossil fuel is dying, making way for renewable energy. Unlike previous cycles, oil will not recover. That's because technology for renewables have reached an inflexion point when it's actually cheap and feasible to use renewables. This will be great for airline stocks (you would know if you have been tracking global airline stocks).
Anyway, back to airlines and AirAsia.
1) AirAsia : Most lagging Airline stock in the WORLD
Do you know that global airline stocks are rallied 200-300-400% in the last 2-3 years??
Southwest Air's share price in the US tripled from 10.62 in 2014 to 42.34 now! Delta Air also nearly tripled from 12.65 to 48!
 

What about AirAsia? AirAsia's share price actually went down 27%! Think it's fair to say that it's time for AirAsia to catch up! A double, or triple maybe. ;)
Anyone who say that Airlines is a not so good business should look at the charts above as proof that airlines is a good business for this cycle. The current economic cycle of low oil prices is a blessing for non-oil logistics as well as tourism travel stocks ie Airlines.

2) AirAsia is super cheap now : only 4.7x PE!
AirAsia is forecasted by HLG Research to make RM822m core profit or 29 sen core EPS for 2016. This means it's only trading at 4.7x 2016 PE. Serious?!
Ryanair and Southwest trades at 13x and 12x PE. This means AirAsia is only 60% cheaper than it's contemporaries. It's ridicilous because AirAsia is a world famous brand and is the strongest proxy to South East Asia. It should trade at least at the SAME valuations as these two stocks ie at least 12-13x. This would mean a potential 150% upside from here.
3) AirAsia profits trending upwards and Higher in 2016-17
Oil and Jet fuel prices have been lower recently, plus AirAsia's hedges will be lower which means much lower fuel costs for coming quarters and higher profits. Plus it has already kitchen sunked it's losses in Indonesia and Philippines, which means a clear financial path for 2016.
All in all, AirAsia's profits will boom higher in 2016 which will make it even cheaper. Pegging a 13x PE fair valuation AirAsia should be trading at above RM3.50 in 1-2 years time. 
 

Wednesday, March 2, 2016

5000港幣起家、40年4萬倍投資回報,他是怎麼炒股的?

「一生都對金錢饑渴」是曹仁超的一句名言。Sir5000港幣起家,歷經2次慘敗,但依然創下404萬倍的投資回報。其經歷不但是投資界的一個傳奇,更對廣大散戶投資者深具啟示意義。

香港著名投資家曹Sir (曹志明)因胃癌於221日逝世,享年68歲。有「香港股神」之稱的曹先生,既是香港乃至華人社會深具影響的投資分析家,也堪稱是香港乃至華人社會最會炒股的人。其經歷不但是投資界的一個傳奇,更對廣大散戶投資者深具啟示意義。特別為分享曹Sir的故事與思想。

一生都對金錢饑渴
「一生都對金錢饑渴」是曹仁超的一句名言。

對金錢如此渴望,因為他曾經實在是窮怕了。祖上曾是大商家的曹先生,3歲到香港,13歲喪父,靠在工廠做工的母親供養三兄弟,扣除房租、學費等必須開支,一家人每個月的生活費只有65塊錢。

曹先生回憶,除了白米飯,連續5年,一家人都只能吃每天2老的三菜一湯:「用鴨血、大豆芽菜和豆腐滾湯,然後再分別烹調這三樣食物。」

貧窮讓曹仁超的童年充滿憂慮甚至恐懼,擔心沒錢交租,要看包租婆的晚娘面孔,或沒錢交學費不敢返學。甚至,有鄰居不見了金首飾,也馬上懷疑是他偷的,要搜他身。最終,他被證明了清白,但對方不但不道歉還反而說他窮,偷雞摸狗是遲早的事。

曹仁超回憶說,那句話刺得他好痛,讓他發誓要爭氣,掙大錢。高中畢業,老師讓同學們談人生目標,很多同學談這個,談那個,曹仁超卻回答:賺大錢。後來認識女朋友時,他的承諾也是:我的夢想是富有,讓你過上舒適的生活。

「我永遠對金錢饑渴(hungry)和貪心(greedy) 」身為億萬富翁,財富足夠家人幾代生活無憂後,曹仁超說自己也依然是這種心態。

因為少年窮對金錢饑渴的曹先生,不但自己夢想賺大錢,也主張所有人理直氣壯去賺錢。


他討厭所謂的銅臭味這個詞,喜歡發達賺錢這些很多人認為充滿銅臭的詞。他說:「中國人一向主張安貧樂道,但貪心才是推動經濟發展的原動力。」並且舉例證明,1980年賺到第一個100萬元時,太太已叫他退休,如果不是他繼續對金錢渴望,可能很快比靠政府救助的人都不如。

曹仁超還開宗明義地說過,中國人有些假清高,這是不必要的。而造成這種局面,是因為輿論往往由寫字的人掌握,而中國寫字的人是很少有發達的,所以就以所謂金錢多了是煩惱來自我安慰。

沒有金錢,我們很難感到幸福,因此人人必須擁有一定財富才可快樂。惟金錢達到一定水準後,更多的財富並不能帶來更大的幸福感,則是事實。

只不過,超級愛財的曹仁超也強調,君子愛財,要取之有道,貪得其所。而炒股,則是他的和他的

1967年高中畢業後,家裡窮,成績不好的曹仁超無心再念書。在母親的主張下,他進入當時紅火的紡織業學習紡織機維修,希望掌握一門技術,有個穩定的謀生之法。

但曹仁超受不了工廠的環境和工作強度,尤其是掙錢少且看不到出頭之日的苦,幹了半年就轉行去假髮行業繼續做工,並且認識了太太。

曹仁超對太太一見鍾情,而且心動就行動,沒有多想就跑到對方面前說,我要追你,直到與你結婚為止。沒成想,太太卻淡淡地回他一句:神經病。後來,在他瘋狂的攻勢下,太太有所妥協但提出條件,不能在工廠做工,要做上穿西裝的人的才行。

曹仁超非但沒有覺得對方嫌自己窮,反而借勢吹捧自己,這個太沒有問題了,我將來要帶你去希爾頓吃飯,上半島吃雪糕,搭的士入龍華吃燒乳鴿。

水吹出去了,但在假髮行業,曹仁超還是看不到什麼希望,加上一位老伯也告訴他說,工字不出頭,幹這一行沒有什麼大出息。於是,他又成天想著要再換跑道。
剛好,一位同學的伯父買了一個股票經紀的牌,需要一個認識英文的人幫忙打下手,於是曹仁超又進入到證券行業,從擦桌子掃地開始,一步步做,月薪220港元。

證券行業讓曹仁超大開眼界,也讓他認定這就是賺大錢的好管道。他抓緊積累本錢,每天兼做多份工作。不但投稿到報館賺稿費,又到股票行隔壁的洋行幫人打英文信,再到旺角教書,晚上替人補習英文。

1969年,存到了5000元的曹仁超用這筆錢做本,開始炒股票。

剛入市場的他,初生牛犢不怕虎,光腳不怕穿鞋的,不但專炒高風險,高回報的股票,還利用當時買賣股票可以在兩周後交割錢款的條件賒購大量股票,最高時曾經手裡拿著一百萬市值的股票但兜裡只有一萬元的現金。

他的運氣也特別好,趕上好行情,不但基本上沒有大虧過,而且曾經一天賺到3萬元,差不多兩年就賺到將近50倍。到1971年年中,他的5000元已變成20多萬元。而當時,普通香港人的月薪不過三、四百元。

曹仁超喜歡講:天要其亡,先令其狂。這是他從自己的經歷中總結出的血的教訓。

快速賺錢,讓曹仁超覺得自己就是股神,忘記了股市有漲也會跌的。1971年下半年,他開始學人融資炒股。結果,中國加入聯合國被市場解讀為利空,指數3個月跌了30%多,大量融資的曹仁超被打回原形,20多萬隻剩下了7000元。

這次慘敗,讓曹仁超體會到了控制風險的重要性。之後,他收兵休戰,並反復思考學習,看了很多關於股市尤其是技術方面的書,提升自己的作戰能力。

調整好狀態後,曹仁超重新再來,不久就王者歸來,到1973年已將市值做到了50萬左右。當時,恒生指數也相當瘋狂,3個月漲了超過40%,有了教訓的曹仁超變得理性,將股票賣掉換成現金,然後和太太到東南亞度了蜜月。

之後,恒生指數果然如他所料,從19733月的高點1774點一路往下跌。到19747月已跌到478點。躲過股災的曹仁超又開始找回投資天才的感覺,認為478點應該是底了,投下50萬買入了後來被李嘉誠收購的和記企業。結果,市場再次給他狠狠一耳光。在他入市之後,恒生指數依然跌跌不休,到197412月最低跌到150點時,他的50萬已只剩下10萬。


也就在那期間,因為經濟大勢不好,曹仁超還被公司炒了。股票蝕出血,還丟了工作,而現在已是拖家帶口的主人,這讓樂觀的曹仁超也無法接受。他還記得,跌到讓他無法承受的那個晚上,他一整晚沒有回家。(未完)